
EUR/USD Current price: 1.1755
- United States political woes and poor employment-data undermines the market mood.
- The US ADP Employment Change report came in at -33,000 in June, much worse than expected.
- EUR/USD corrects lower, could test the 1.1700 area in the near term.
The EUR/USD pair came under selling pressure throughout the first half of the day, although the broad US Dollar (USD) weakness kept the slide limited. Market players keep their eyes on the United States (US) amid fiscal and political woes.
On Tuesday, the US Senate passed US President Donald Trump’s “One Big Beautiful Bill” by a very slim margin, as the vote was split 50-50, with Vice-President JD Vance defining the vote. The bill has now passed to the House for debate. Stocks turned south amid speculation that the big tax cut promised by President Trump will not happen.
At the same time, Trump’s threats to Federal Reserve (Fed) Chair Jerome Powell affect the mood. Powell & co maintain interest rates at restrictive levels amid uncertainty about the impact of tariffs on inflation. President Trump is furious with Powell’s stance.
Other than that, the country has just released the ADP Employment Change report, which showed that the private sector lost 33,000 job positions in June, much worse than the 95,000 additions expected. Even further, the May reading was downwardly revised to 29,000 from the 37,000 previously reported. The Greenback fell with the negative surprise, helping EUR/USD bounce from an intraday low of 1.1747.
The macroeconomic calendar has nothing more to offer today, but European Central Bank (ECB) President Christine Lagarde is delivering the closing remarks at the central bank forum in Sintra, Portugal.
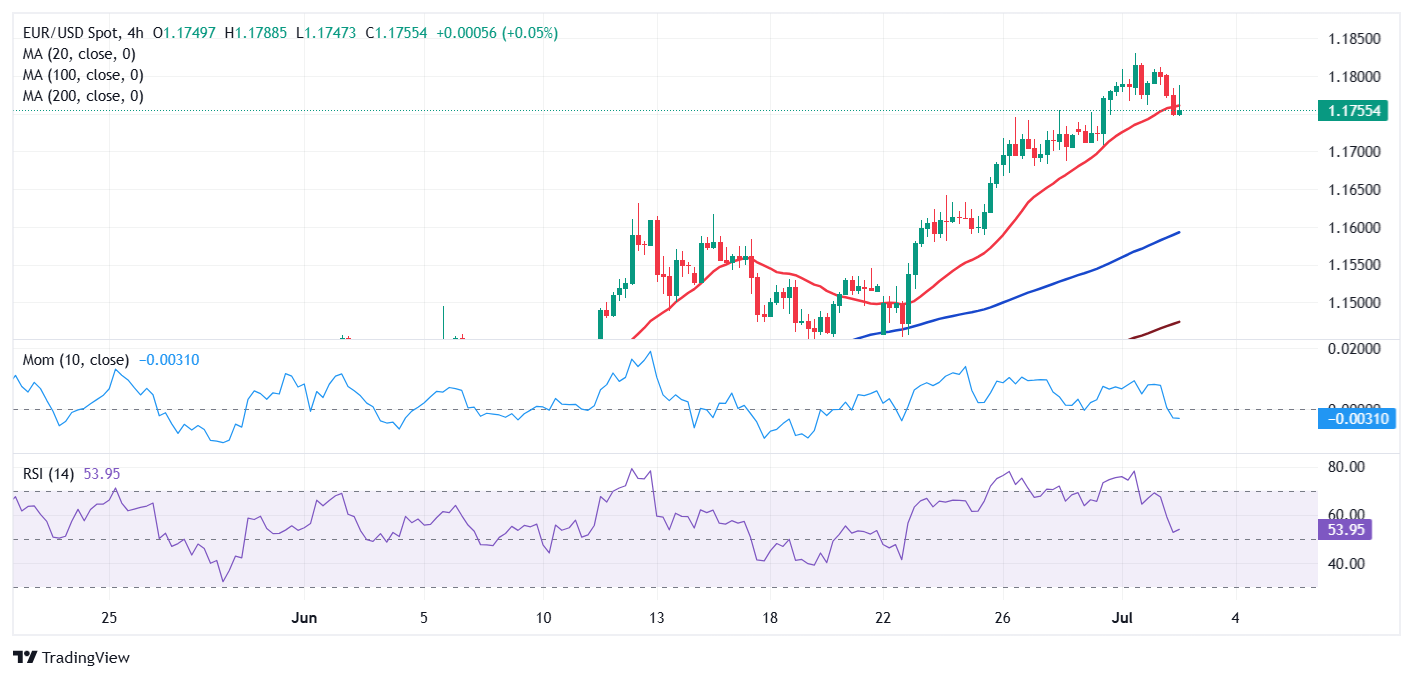
EUR/USD short-term technical outlook
The daily chart for the EUR/USD pair shows it is finally correcting after advancing for nine days in a row. The slide is limited as the dominant trend is bullish, and higher highs are still likely, but not in the near term. The mentioned chart shows technical indicators heading lower, yet with the Relative Strength Index (RSI) indicator still within overbought readings. At the same time, the pair develops far above bullish moving averages, with the 20 Simple Moving Average (SMA) currently at around 1.1570.
In the near term, the EUR/USD pair is battling around a bullish 20 SMA after briefly falling below it. The 4-hour chart also shows the 100 and 200 SMAs heading firmly higher, well below the current level, reflecting buyers’ dominance. Finally, technical indicators turned lower, yet remain above their midlines, limiting the odds for a steeper decline.
Support levels: 1.1745 1.1695 1.1640
Resistance levels: 1.1830 1.1880 1.1910
Information on these pages contains forward-looking statements that involve risks and uncertainties. Markets and instruments profiled on this page are for informational purposes only and should not in any way come across as a recommendation to buy or sell in these assets. You should do your own thorough research before making any investment decisions. FXStreet does not in any way guarantee that this information is free from mistakes, errors, or material misstatements. It also does not guarantee that this information is of a timely nature. Investing in Open Markets involves a great deal of risk, including the loss of all or a portion of your investment, as well as emotional distress. All risks, losses and costs associated with investing, including total loss of principal, are your responsibility. The views and opinions expressed in this article are those of the authors and do not necessarily reflect the official policy or position of FXStreet nor its advertisers. The author will not be held responsible for information that is found at the end of links posted on this page.
If not otherwise explicitly mentioned in the body of the article, at the time of writing, the author has no position in any stock mentioned in this article and no business relationship with any company mentioned. The author has not received compensation for writing this article, other than from FXStreet.
FXStreet and the author do not provide personalized recommendations. The author makes no representations as to the accuracy, completeness, or suitability of this information. FXStreet and the author will not be liable for any errors, omissions or any losses, injuries or damages arising from this information and its display or use. Errors and omissions excepted.
The author and FXStreet are not registered investment advisors and nothing in this article is intended to be investment advice.