- WTI Crude Oil falls over 3% intraday on Friday but remains up 2.25% for the week.
- Geopolitical volatility spikes after US President Trump announces the deployment of nuclear submarines near Russia.
- Technically, WTI remains trapped in a symmetrical triangle with the price now approaching the lower boundary.
West Texas Intermediate (WTI) Crude Oil is under pressure heading into the weekend, with the price sliding over 3% on Friday to trade near $66.70, pulling back from its highest level near $70 since June 23, reached on Wednesday. WTI is trading near $66.67 at the time of writing, down over 3% intraday, as technical resistance and profit-taking weigh on prices. Despite the pullback, Crude Oil is still up around 2.25% on the week.
Adding to the volatility, geopolitical tensions flared again after US President Donald Trump announced on Friday via Truth Social that he had ordered two nuclear submarines to be positioned in regions near Russia, responding to “highly provocative statements” made by Dmitry Medvedev, the former Russian President and current Deputy Chairman of the Security Council. Trump warned that “words are very important and can often lead to unintended consequences,” fueling renewed market concern over energy security and the broader geopolitical landscape.
This comes after Trump, earlier in the week, threatened to impose steep secondary tariffs on countries continuing to import Russian crude oil, with particular reference to India and China. The combined signals from Washington have reignited fears of escalating global tensions, adding fuel to an already fragile market sentiment surrounding US trade policy.
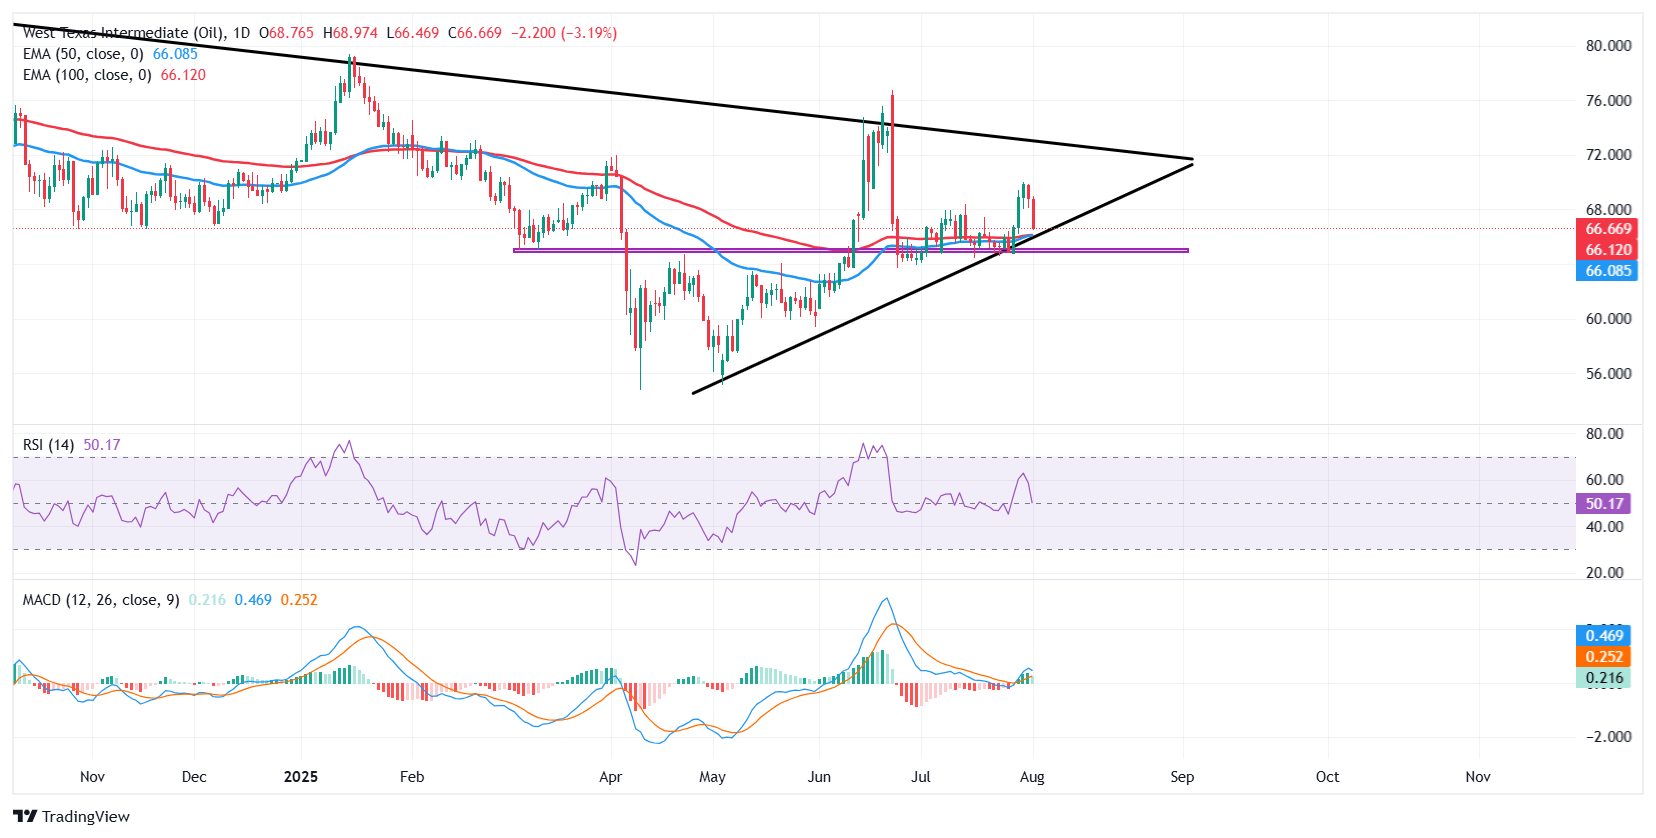
From a technical perspective, WTI remains trapped within a large symmetrical triangle pattern on the daily chart, formed by a series of lower highs and higher lows. Crude Oil prices faced strong rejection near the $70.00 psycjological level earlier in the week, while Friday’s sell-off has dragged the commodity down toward the ascending support line that has held since early May.
Notably, this support zone aligns closely with the converging 50-day and 100-day Exponential Moving Averages (EMAs), currently situated around $66.08 and $66.12, respectively. This confluence of dynamic and trendline support marks a pivotal area for price action, where a decisive break below could trigger a bearish breakout from the triangle and accelerate losses toward the $63.00-$60.00 zone.
Conversely, if buyers step in and successfully defend this area, it could spark a rebound toward the upper boundary of the triangle, with initial resistance at $70.00, followed by a possible retest of the June 23 high at $76.74.
The Relative Strength Index (RSI) is holding just above neutral at 50.30, suggesting consolidation with no strong directional bias yet. Meanwhile, the Moving Average Convergence-Divergence (MACD) indicator remains modestly in bullish territory, but the flattening histogram and narrowing gap between the MACD and signal line hint at diminishing upward momentum.
WTI Oil FAQs
WTI Oil is a type of Crude Oil sold on international markets. The WTI stands for West Texas Intermediate, one of three major types including Brent and Dubai Crude. WTI is also referred to as “light” and “sweet” because of its relatively low gravity and sulfur content respectively. It is considered a high quality Oil that is easily refined. It is sourced in the United States and distributed via the Cushing hub, which is considered “The Pipeline Crossroads of the World”. It is a benchmark for the Oil market and WTI price is frequently quoted in the media.
Like all assets, supply and demand are the key drivers of WTI Oil price. As such, global growth can be a driver of increased demand and vice versa for weak global growth. Political instability, wars, and sanctions can disrupt supply and impact prices. The decisions of OPEC, a group of major Oil-producing countries, is another key driver of price. The value of the US Dollar influences the price of WTI Crude Oil, since Oil is predominantly traded in US Dollars, thus a weaker US Dollar can make Oil more affordable and vice versa.
The weekly Oil inventory reports published by the American Petroleum Institute (API) and the Energy Information Agency (EIA) impact the price of WTI Oil. Changes in inventories reflect fluctuating supply and demand. If the data shows a drop in inventories it can indicate increased demand, pushing up Oil price. Higher inventories can reflect increased supply, pushing down prices. API’s report is published every Tuesday and EIA’s the day after. Their results are usually similar, falling within 1% of each other 75% of the time. The EIA data is considered more reliable, since it is a government agency.
OPEC (Organization of the Petroleum Exporting Countries) is a group of 12 Oil-producing nations who collectively decide production quotas for member countries at twice-yearly meetings. Their decisions often impact WTI Oil prices. When OPEC decides to lower quotas, it can tighten supply, pushing up Oil prices. When OPEC increases production, it has the opposite effect. OPEC+ refers to an expanded group that includes ten extra non-OPEC members, the most notable of which is Russia.
Information on these pages contains forward-looking statements that involve risks and uncertainties. Markets and instruments profiled on this page are for informational purposes only and should not in any way come across as a recommendation to buy or sell in these assets. You should do your own thorough research before making any investment decisions. FXStreet does not in any way guarantee that this information is free from mistakes, errors, or material misstatements. It also does not guarantee that this information is of a timely nature. Investing in Open Markets involves a great deal of risk, including the loss of all or a portion of your investment, as well as emotional distress. All risks, losses and costs associated with investing, including total loss of principal, are your responsibility. The views and opinions expressed in this article are those of the authors and do not necessarily reflect the official policy or position of FXStreet nor its advertisers. The author will not be held responsible for information that is found at the end of links posted on this page.
If not otherwise explicitly mentioned in the body of the article, at the time of writing, the author has no position in any stock mentioned in this article and no business relationship with any company mentioned. The author has not received compensation for writing this article, other than from FXStreet.
FXStreet and the author do not provide personalized recommendations. The author makes no representations as to the accuracy, completeness, or suitability of this information. FXStreet and the author will not be liable for any errors, omissions or any losses, injuries or damages arising from this information and its display or use. Errors and omissions excepted.
The author and FXStreet are not registered investment advisors and nothing in this article is intended to be investment advice.


