
- USD/CHF breaks under 50-day SMA at 0.8020, closing below 0.8000 with momentum favoring further downside.
- Bears eye 0.7950 and July 23 low at 0.7911, with path open toward year-to-date trough at 0.7872.
- Buyers must reclaim 0.8000 and 50-day SMA to challenge resistance at 0.8047 and 100-day SMA at 0.8122.
The USD/CHF extended its losses on Friday, tumbling below the 50-day Simple Moving Average (SMA) at 0.8020. The release of a worse than expected US Nonfarm Payrolls report, cemented the case for a Fed rate cut at the September meeting. At the time of writing, the pair trades at 0.7980, down 0.94%.
USD/CHF Price Forecast: Technical outlook
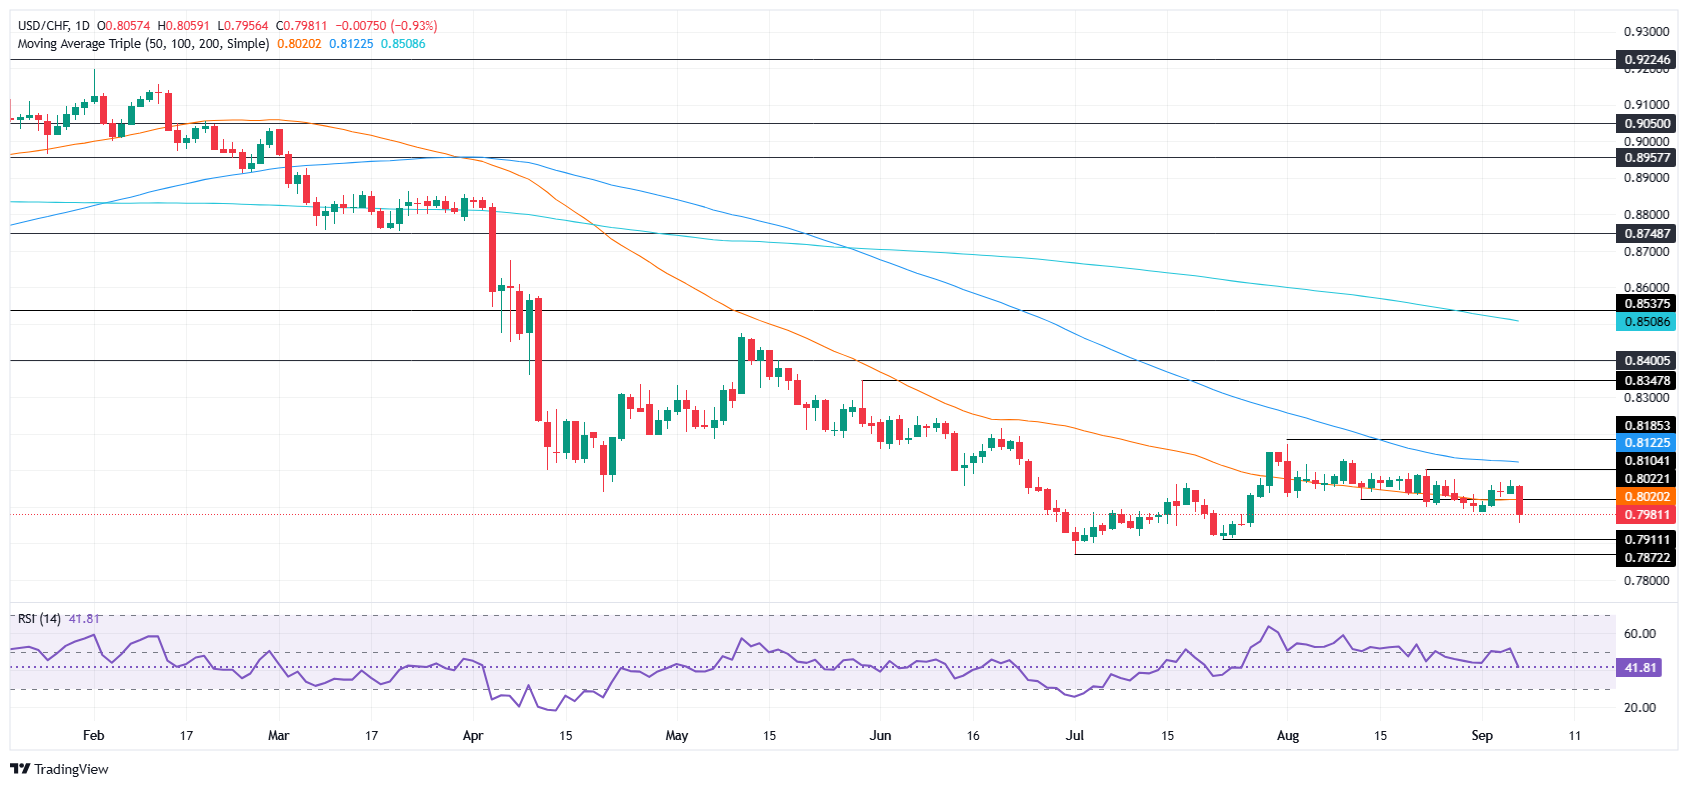
Price action indicates that sellers reclaimed momentum, achieving a daily/weekly close below the 0.8000 figure. This reignited the chances for testing the year-to-date (YTD) low of 0.7872, reached on July 1.
Momentum indicates that bears are in control as depicted by the Relative Strength Index (RSI).
That said, if USD/CHF drops below 0.7950, this will expose July 23 low of 0.7911. A breach of the latter clears the path to test 0.7900, followed by the YTD low.
On the other hand, if buyers reclaim 0.8000, they must clear the 50-day SMA, before testing the 20-day SMA at 0.8047. Key resistance lies overhead at the 100-day SMA at 0.8122.
USD/CHF Price Chart – Daily
Swiss Franc Price This week
The table below shows the percentage change of Swiss Franc (CHF) against listed major currencies this week. Swiss Franc was the strongest against the Canadian Dollar.
| USD | EUR | GBP | JPY | CAD | AUD | NZD | CHF | |
|---|---|---|---|---|---|---|---|---|
| USD | -0.19% | -0.10% | 0.28% | 0.68% | -0.16% | -0.06% | -0.20% | |
| EUR | 0.19% | 0.09% | 0.40% | 0.89% | 0.03% | 0.15% | 0.00% | |
| GBP | 0.10% | -0.09% | 0.20% | 0.77% | -0.06% | 0.04% | -0.04% | |
| JPY | -0.28% | -0.40% | -0.20% | 0.47% | -0.44% | -0.31% | -0.43% | |
| CAD | -0.68% | -0.89% | -0.77% | -0.47% | -0.79% | -0.73% | -0.81% | |
| AUD | 0.16% | -0.03% | 0.06% | 0.44% | 0.79% | 0.10% | 0.02% | |
| NZD | 0.06% | -0.15% | -0.04% | 0.31% | 0.73% | -0.10% | -0.07% | |
| CHF | 0.20% | -0.01% | 0.04% | 0.43% | 0.81% | -0.02% | 0.07% |
The heat map shows percentage changes of major currencies against each other. The base currency is picked from the left column, while the quote currency is picked from the top row. For example, if you pick the Swiss Franc from the left column and move along the horizontal line to the US Dollar, the percentage change displayed in the box will represent CHF (base)/USD (quote).
Information on these pages contains forward-looking statements that involve risks and uncertainties. Markets and instruments profiled on this page are for informational purposes only and should not in any way come across as a recommendation to buy or sell in these assets. You should do your own thorough research before making any investment decisions. FXStreet does not in any way guarantee that this information is free from mistakes, errors, or material misstatements. It also does not guarantee that this information is of a timely nature. Investing in Open Markets involves a great deal of risk, including the loss of all or a portion of your investment, as well as emotional distress. All risks, losses and costs associated with investing, including total loss of principal, are your responsibility. The views and opinions expressed in this article are those of the authors and do not necessarily reflect the official policy or position of FXStreet nor its advertisers. The author will not be held responsible for information that is found at the end of links posted on this page.
If not otherwise explicitly mentioned in the body of the article, at the time of writing, the author has no position in any stock mentioned in this article and no business relationship with any company mentioned. The author has not received compensation for writing this article, other than from FXStreet.
FXStreet and the author do not provide personalized recommendations. The author makes no representations as to the accuracy, completeness, or suitability of this information. FXStreet and the author will not be liable for any errors, omissions or any losses, injuries or damages arising from this information and its display or use. Errors and omissions excepted.
The author and FXStreet are not registered investment advisors and nothing in this article is intended to be investment advice.


