XAU/USD Current price: $3,384.41
- US President Trump threatened new tariffs and tried to fire Fed Governor Cook.
- The US CB Consumer Confidence index ticked slightly lower in August.
- XAU/USD trades near fresh weekly highs, aiming to extend its advance.
Gold prices seesawed between gains and losses late on Monday, falling towards $3,351.39 early on Tuesday. The bright metal later recovered, peaking at around $3,386, to finally stabilize near its intraday peak.
Markets turned risk-averse early in Asia, following comments from United States (US) President Donald Trump. Trump once again put into doubt the Federal Reserve (Fed) independence by deciding to fire Governor Lisa Cook amid allegations of mortgage application irregularities. Cook denied Trump’s authority to dismiss her and said she will remain as Governor. The case will likely end in a courtroom. Other than that, President Trump threatened to impose new tariffs on those countries applying digital taxes on US tech companies.
Asian and European indexes closed in the red, while the US Dollar (USD) benefited from the risk-averse environment, trimming most of its Friday’s losses.
Wall Street, however, managed to post some modest gains after better-than-anticipated US data lifted the mood. On the one hand, the US published July Durable Goods Orders, which were down 2.8%, better than the previous 9.3% and the expected -4%.
On the other hand, the Conference Board Consumer Sentiment eased slightly to 97.4 in August from a revised 98.7 in July, but beat the expected 96.4. The report also showed that the Present Situation Index dropped by 1.6 points to 131.2, while the Expectations Index fell by 1.2 points to 74.8, remaining below the 80-point level usually associated with recession fears.
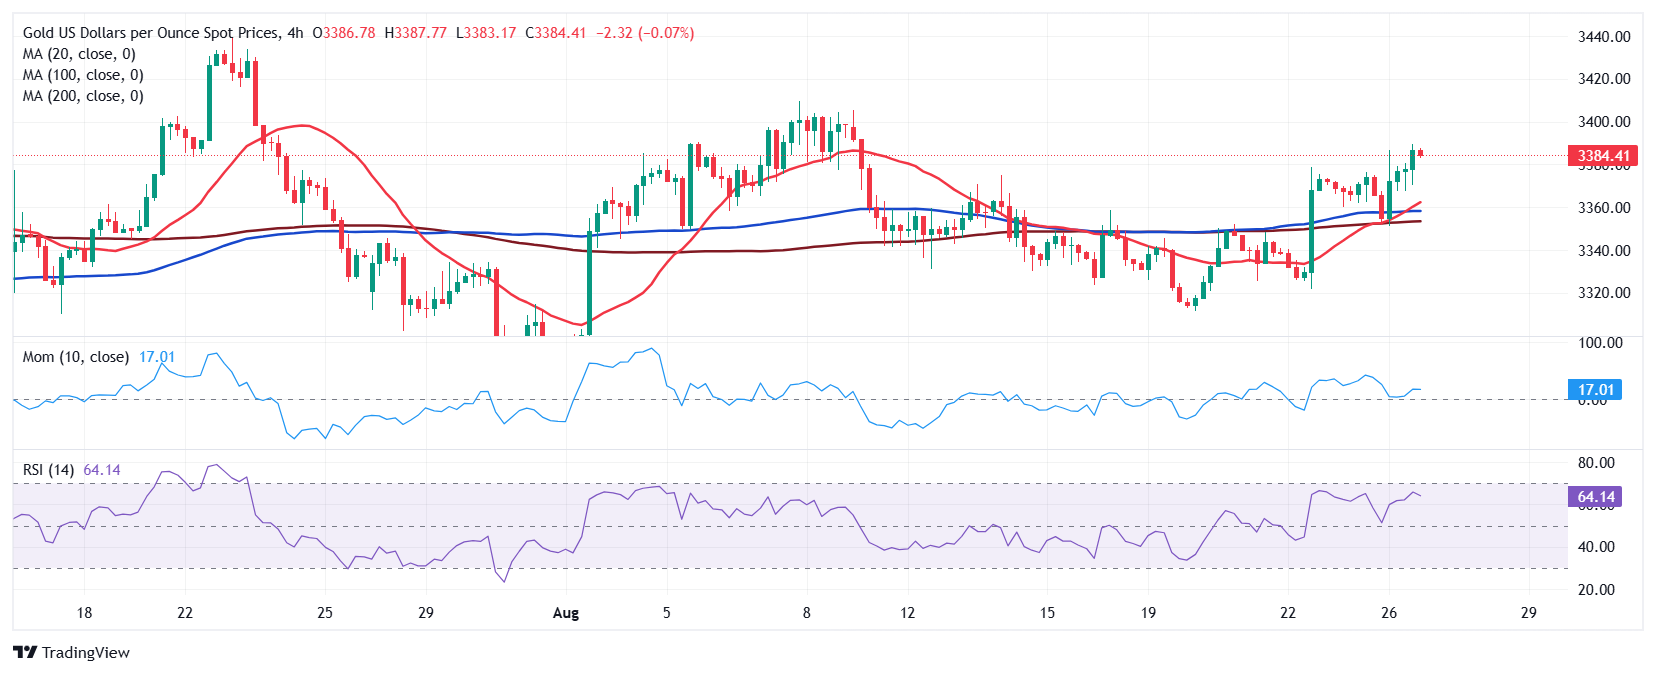
XAU/USD short-term technical outlook
The better mood weighed on USD demand, helping XAU/USD to regain its bullish poise. The pair is neutral-to-bullish according to technical readings in the daily chart, as it held above all its moving averages. In fact, a flat 20 Simple Moving Average (SMA) provided intraday support at around $3,350. Technical indicators, in the meantime, turned north, although the Momentum indicator remains within neutral levels, reflecting limited buyers’ strength.
In the near term, and according to the 4-hour chart, XAU/USD is bullish. The pair bounced from a bullish 20 SMA, which is now crossing above a flat 100 SMA after already surpassing the 200 SMA. Technical indicators, in the meantime, resumed their advances well into positive territory, supporting higher highs ahead.
Support levels: 3,368.20 3,350.50 3,337.60
Resistance levels: 3,391.20 3,405.80 3,421.10
Information on these pages contains forward-looking statements that involve risks and uncertainties. Markets and instruments profiled on this page are for informational purposes only and should not in any way come across as a recommendation to buy or sell in these assets. You should do your own thorough research before making any investment decisions. FXStreet does not in any way guarantee that this information is free from mistakes, errors, or material misstatements. It also does not guarantee that this information is of a timely nature. Investing in Open Markets involves a great deal of risk, including the loss of all or a portion of your investment, as well as emotional distress. All risks, losses and costs associated with investing, including total loss of principal, are your responsibility. The views and opinions expressed in this article are those of the authors and do not necessarily reflect the official policy or position of FXStreet nor its advertisers. The author will not be held responsible for information that is found at the end of links posted on this page.
If not otherwise explicitly mentioned in the body of the article, at the time of writing, the author has no position in any stock mentioned in this article and no business relationship with any company mentioned. The author has not received compensation for writing this article, other than from FXStreet.
FXStreet and the author do not provide personalized recommendations. The author makes no representations as to the accuracy, completeness, or suitability of this information. FXStreet and the author will not be liable for any errors, omissions or any losses, injuries or damages arising from this information and its display or use. Errors and omissions excepted.
The author and FXStreet are not registered investment advisors and nothing in this article is intended to be investment advice.


