
- Gold extends its six-day winning streak to clinch fresh lifetime highs above $3,500 early Tuesday.
- The US Dollar rebounds from over one-month lows, limiting Gold’s upside for now.
- Fed rate cut bets and Russia-Ukraine geopolitical woes keep Gold underpinned.
- Gold eyes more gains even as the RSI enters the overbought region on the daily sticks.
Gold has quickly reversed an uptick to fresh all-time-highs above $3,500, gathering pace for a sustained move again above that level. All eyes now turn to the US ISM Manufacturing PMI due later in the day for further trading directives.
Gold capitalizes on Fed rate outlook, geopolitics
Gold extends its bullish momentum into a sixth straight day, but the further upside appears capped (for now), in the face of a resurgent buying interest in the US Dollar (USD).
The USD sees a short-covering bounce from over one-month troughs across the board, driven by profit taking, as traders cash in before the releases of crucial US business surveys and employment data due this week.
The US ISM Manufacturing PMI is on the radar next as speculations over a jumbo interest rate cut by the US Federal Reserve (Fed) this month grow. A 25 basis points (bps) September rate cut is fully baked in, with the CME Group’s Fed Watch Tool showing a 90% chance.
The headline ISM Manufacturing PMI is expected to advance to 49 in August from 48 in July, remaining in contraction.
On the data disappointment, the Greenback could come under renewed selling pressure, keeping the record rally in Gold alive.
Additionally, concerns over the Fed’s autonomy amidst US President Donald Trump’s continued efforts to rope in more dovish appointments to the US central bank remain a drag on the USD, while supporting the bright metal.
The geopolitical developments between Russia and Ukraine also remain in focus, underpinning the traditional safe-haven Gold. On Sunday, Ukraine’s President Volodymyr Zelenskiy said Ukraine plans new strikes deep into Russia after weeks of intensified attacks on Russian energy assets, per Reuters.
Trump noted last week that he was deeply disappointed, particularly in light of his recent attempts to mediate between Russia and Ukraine to bring an end to the war.
Gold price technical analysis: Daily chart
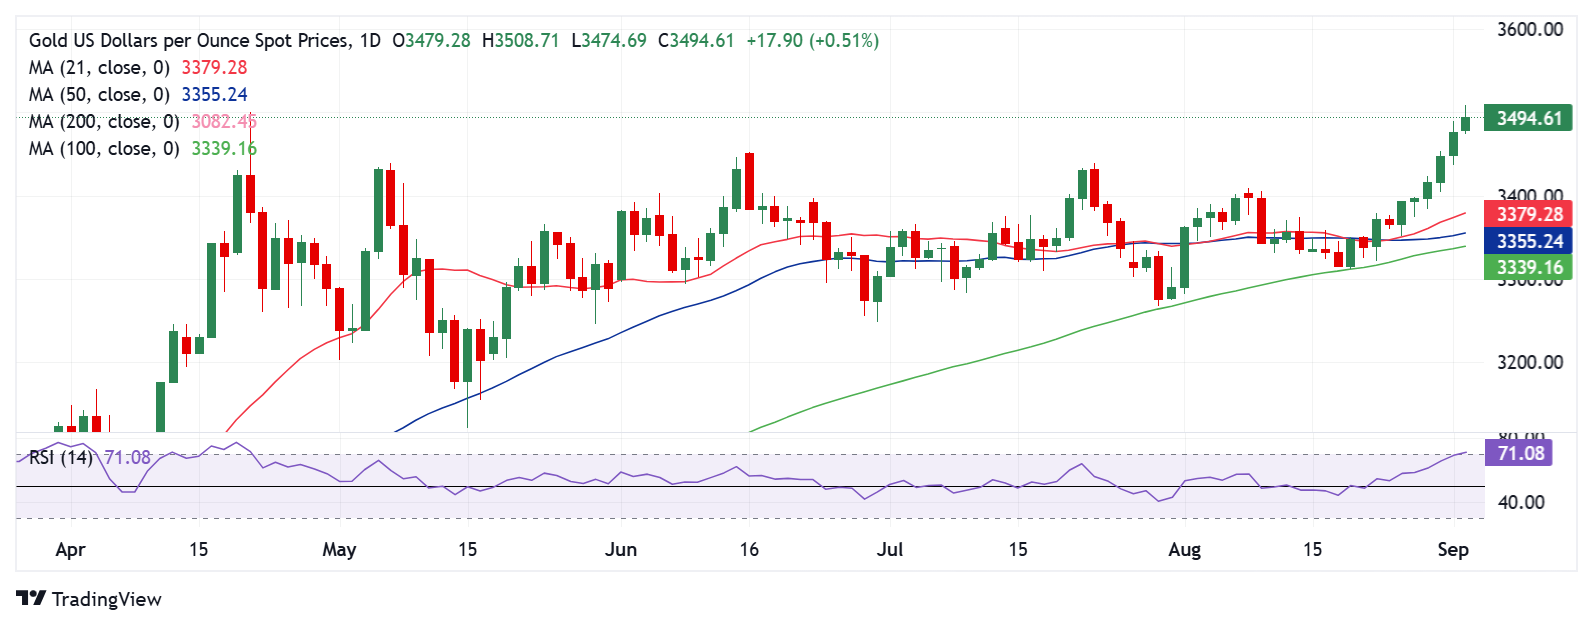
The daily chart shows that Gold eyes more upside as the 14-day Relative Strength Index (RSI) is still not heavily overbought. The leading indicator is currently near 71.
The Bull Cross of the 21-day Simple Moving Average (SMA) and the 50-day SMA also keeps the buoyant tone intact around the bullion.
The immediate topside hurdle is seen at the new record high of $,3509, above which the $3,550 psychological level will be challenged.
Conversely, any pullback will challenge the intraday of $3,475 initially, followed by this week’s low of $3,437.
The $3,400 round level will be attacked on a sustained break below the latter.
Economic Indicator
ISM Manufacturing PMI
The Institute for Supply Management (ISM) Manufacturing Purchasing Managers Index (PMI), released on a monthly basis, is a leading indicator gauging business activity in the US manufacturing sector. The indicator is obtained from a survey of manufacturing supply executives based on information they have collected within their respective organizations. Survey responses reflect the change, if any, in the current month compared to the previous month. A reading above 50 indicates that the manufacturing economy is generally expanding, a bullish sign for the US Dollar (USD). A reading below 50 signals that factory activity is generally declining, which is seen as bearish for USD.
The Institute for Supply Management’s (ISM) Manufacturing Purchasing Managers Index (PMI) provides a reliable outlook on the state of the US manufacturing sector. A reading above 50 suggests that the business activity expanded during the survey period and vice versa. PMIs are considered to be leading indicators and could signal a shift in the economic cycle. Stronger-than-expected prints usually have a positive impact on the USD. In addition to the headline PMI, the Employment Index and the Prices Paid Index numbers are watched closely as they shine a light on the labour market and inflation.
Information on these pages contains forward-looking statements that involve risks and uncertainties. Markets and instruments profiled on this page are for informational purposes only and should not in any way come across as a recommendation to buy or sell in these assets. You should do your own thorough research before making any investment decisions. FXStreet does not in any way guarantee that this information is free from mistakes, errors, or material misstatements. It also does not guarantee that this information is of a timely nature. Investing in Open Markets involves a great deal of risk, including the loss of all or a portion of your investment, as well as emotional distress. All risks, losses and costs associated with investing, including total loss of principal, are your responsibility. The views and opinions expressed in this article are those of the authors and do not necessarily reflect the official policy or position of FXStreet nor its advertisers. The author will not be held responsible for information that is found at the end of links posted on this page.
If not otherwise explicitly mentioned in the body of the article, at the time of writing, the author has no position in any stock mentioned in this article and no business relationship with any company mentioned. The author has not received compensation for writing this article, other than from FXStreet.
FXStreet and the author do not provide personalized recommendations. The author makes no representations as to the accuracy, completeness, or suitability of this information. FXStreet and the author will not be liable for any errors, omissions or any losses, injuries or damages arising from this information and its display or use. Errors and omissions excepted.
The author and FXStreet are not registered investment advisors and nothing in this article is intended to be investment advice.