
XAU/USD Current price: $3,367.06
- The US Dollar temporarily benefited from upbeat United States data.
- Focus returns to trade deals and mounting tensions between Trump and Powell.
- XAU/USD recovered from around $3,345, lacks additional momentum.
Spot Gold is in the red on Thursday, down for a second consecutive day amid a better market mood undermining demand for the bright metal. The XAU/USD eased from a Wednesday’s peak at $3,439.07, and traded as low $3,351.55 on Thursday, falling on the back of encouraging United States (US) data. Initial Jobless Claims rose by less than anticipated in the week ended July 19, signaling a healthy labor market ahead of the Federal Reserve (Fed) monetary policy decision and the July Nonfarm Payrolls (NFP) report.
Also, the preliminary estimates of the US July S&P Global Purchasing Managers’ Index (PMI) indicated that US business activity grew at a faster in July, with the composite index rising to 54.6 from the previous month’s 52.9. Services output increased while manufacturing activity declined in the same period.
However, the US Dollar (USD) strength was short-lived, overshadowed by risk-on news. The US sealed a trade deal with Japan on Wednesday, and hinted at another one coming with the Eurozone ahead of the deadline set on August 1. Wall Street rallied towards record highs, holding nearby at the time of writing.
Other than that, speculative interest remained away from mounting US political tensions. US President Donald Trump’s personal war against Fed Chairman Jerome Powell has put investors on edge these last few days, maintaining the Greenback on the back foot.
XAU/USD short-term technical outlook
From a technical point of view, the daily chart for the XAU/USD pair shows it bottomed near a flat 20 Simple Moving Average (SMA), providing dynamic support at around $3,342.50. The 100 and 200 SMAs, in the meantime, maintain their upward slopes below the shorter one, in line with the long-lasting bullish trend and despite the ongoing retracement. Finally, technical indicators ease, but remain above their midlines, hinting at a limited bearish potential.
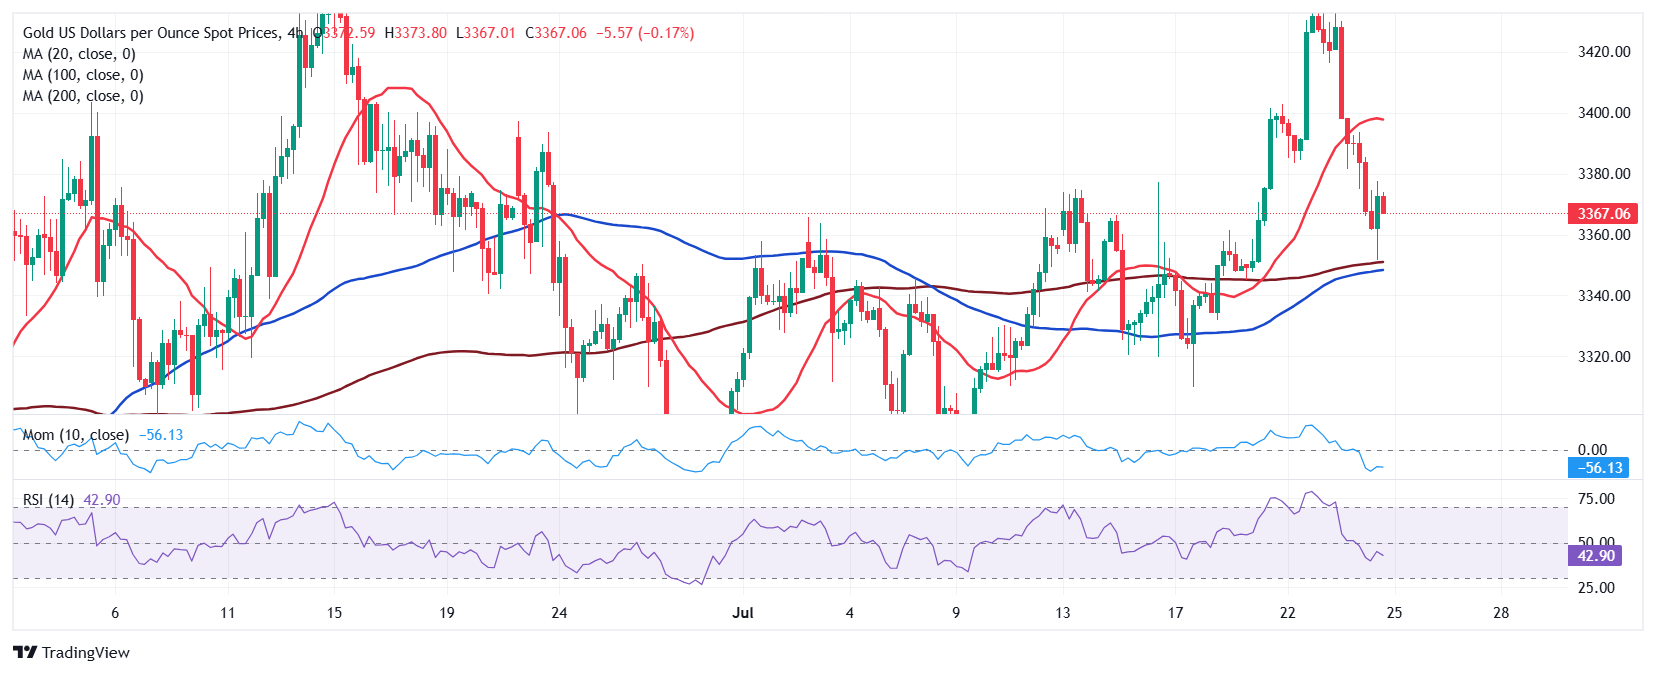
In the near term, and according to the 4-hour chart, the XAU/USD pair bounced from around converging and directionless 100 and 200 SMA, currently at around $3,350. At the same time, the 20 SMA has lost its bullish momentum after the price fell below it, now acting as dynamic resistance in the $3,400 area, reinforcing the relevance of the resistance. Finally, technical indicators tick higher, but remain within negative levels, not enough to support another leg north.
Support levels: 3,342.50 3,331.70 3,318.40
Resistance levels: 3,377.10 3,395.55 3,407.80
Information on these pages contains forward-looking statements that involve risks and uncertainties. Markets and instruments profiled on this page are for informational purposes only and should not in any way come across as a recommendation to buy or sell in these assets. You should do your own thorough research before making any investment decisions. FXStreet does not in any way guarantee that this information is free from mistakes, errors, or material misstatements. It also does not guarantee that this information is of a timely nature. Investing in Open Markets involves a great deal of risk, including the loss of all or a portion of your investment, as well as emotional distress. All risks, losses and costs associated with investing, including total loss of principal, are your responsibility. The views and opinions expressed in this article are those of the authors and do not necessarily reflect the official policy or position of FXStreet nor its advertisers. The author will not be held responsible for information that is found at the end of links posted on this page.
If not otherwise explicitly mentioned in the body of the article, at the time of writing, the author has no position in any stock mentioned in this article and no business relationship with any company mentioned. The author has not received compensation for writing this article, other than from FXStreet.
FXStreet and the author do not provide personalized recommendations. The author makes no representations as to the accuracy, completeness, or suitability of this information. FXStreet and the author will not be liable for any errors, omissions or any losses, injuries or damages arising from this information and its display or use. Errors and omissions excepted.
The author and FXStreet are not registered investment advisors and nothing in this article is intended to be investment advice.