
- UK employment and inflation figures disappointed, weighing on Sterling Pound.
- United States President Donald Trump spurred risk aversion, helping the US Dollar.
- The GBP/USD pair fell for a third consecutive week and aims for lower lows.
GBP/USD fell for three weeks in a row as risk aversion favored demand for the US Dollar (USD), while tepid United Kingdom (UK) data undermined demand for the Sterling Pound (GBP). The pair bottomed at 1.3365 mid-week, its lowest since May, recovering roughly 100 pips ahead of the weekly close.
US political and fiscal concerns weighing on sentiment
Investors spent the week on their toes amid United States (US) fiscal and political woes. On the one hand, concerns revolved around US President Donald Trump’s rage against Federal Reserve (Fed) Chairman Jerome Powell, following the latter’s decision to keep interest rates floating between 4.25% and 4.50%.
Throughout the week, tensions mounted as President Trump demanded lower rates, claiming that the benchmark interest rate should be at least 3 points lower than its current level.
The USD ran on Wednesday, following news that Trump asked a group of House Republicans whether he should fire the Fed’s Chair in a meeting that took place in the Oval Office on Tuesday night, while the New York Times reported that Trump had already drafted a letter to fire the Fed Chair. The news was quickly denied by the US President, who told Reuters he is not planning on doing anything and that any change will occur in the next eight months. It is worth remembering that Powell’s term ends in May 2026.
Meanwhile, Trump posted on Truth Social that there is “virtually no inflation” in the US, right after the country released the June Consumer Price Index (CPI), which came in line with expectations, albeit hotter than in May. The index was up by 0.3% in the month and by 2.7% on a yearly basis, matching the market’s expectations yet above the previous 0.1% and 2.4% respectively. Core annual inflation hit 2.9%, up from the previous 2.8%, although below the 3.0% expected by market analysts.
The headlines triggered quite a volatile price reaction, with the GBP/USD pair seesawing in a 100 pips range.
UK macroeconomic figures added pressure on the Pound Sterling
The UK CPI advanced by 3.6% YoY in June after reporting a 3.4% growth in May, higher than the 3.4% anticipated. The core annual CPI rose 3.7% YoY, surpassing the 3.5% posted in May. The Bank of England (BoE) 2% inflation goal seems further away after the June figures.
UK employment-related figures were also discouraging as the UK ILO Unemployment rose to 4.7% in the three months to May after reporting 4.6% in the quarter to April, and above the market’s consensus of 4.6%. Additionally, the number of people claiming jobless benefits increased 25.9K in June, compared with a revised increase of 15.3K in May, above the expected 17.9K figure.
Also, BoE Governor Andrew Bailey gave his annual ’Mansion House’ address to London’s financial sector on Tuesday, along with finance minister Rachel Reeves.
Calling for greater cooperation between countries, referring to the US and China, to resolve “unsustainable” trade and financial imbalances that are distorting economies and lie behind escalating political tensions.
The US also reported that the Producer Price Index (PPI) in June rose by less than anticipated, up 2.3% YoY vs the 2.5% anticipated and the previous 2.6%. Additionally, Retail Sales were up by 0.6% MoM in June, better than the 0.1% advance expected and the previous 0.9% slide.
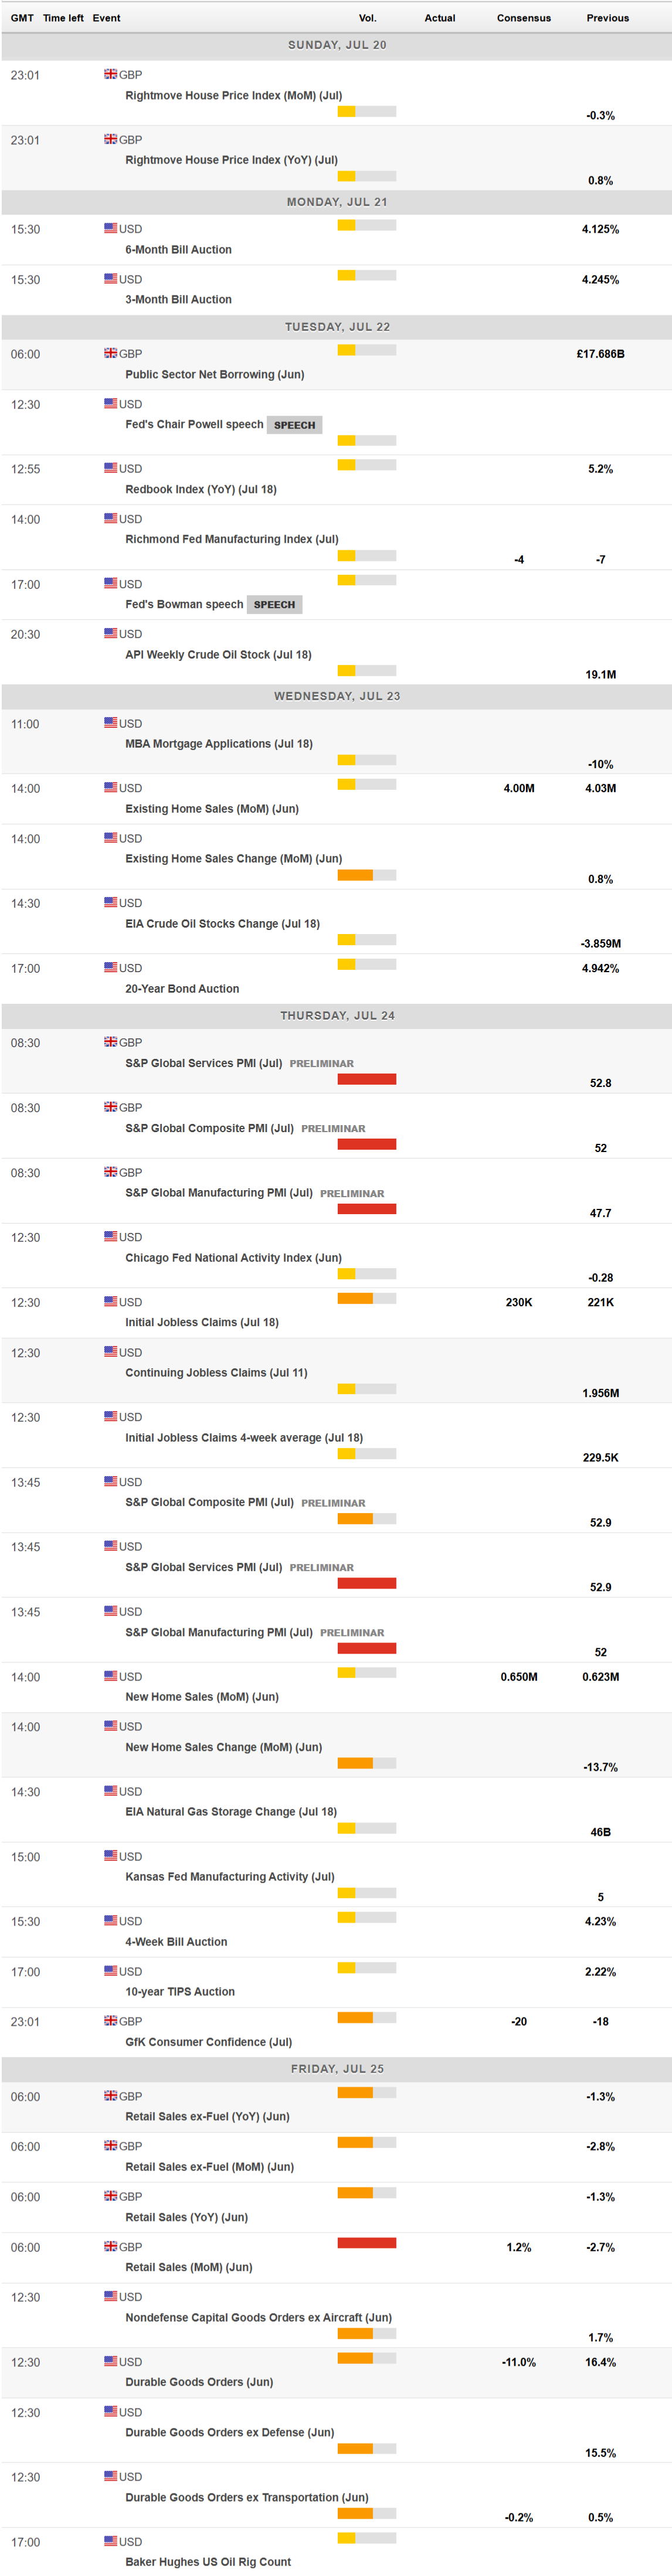
The upcoming days will bring the preliminary estimates of the UK Hamburg Commercial Bank (HCOB) and the US S&P Global Purchasing Managers’ Indexes (PMIs). The UK will also release Retail Sales, while the US will unveil Durable Goods Orders.
GBP/USD technical outlook
The weekly chart for the GBP/USD pair shows it fell for a third consecutive week, and that there’s room for another leg south. The pair develops above all its moving averages, with the 20 Simple Moving Average (SMA) maintaining its bullish slope while providing dynamic support at around 1.3300. The 100 and 200 SMAs, in the meantime, lack clear directional strength far below the shorter one. Finally, technical indicators head firmly south within positive levels, reflecting sellers’ strength.
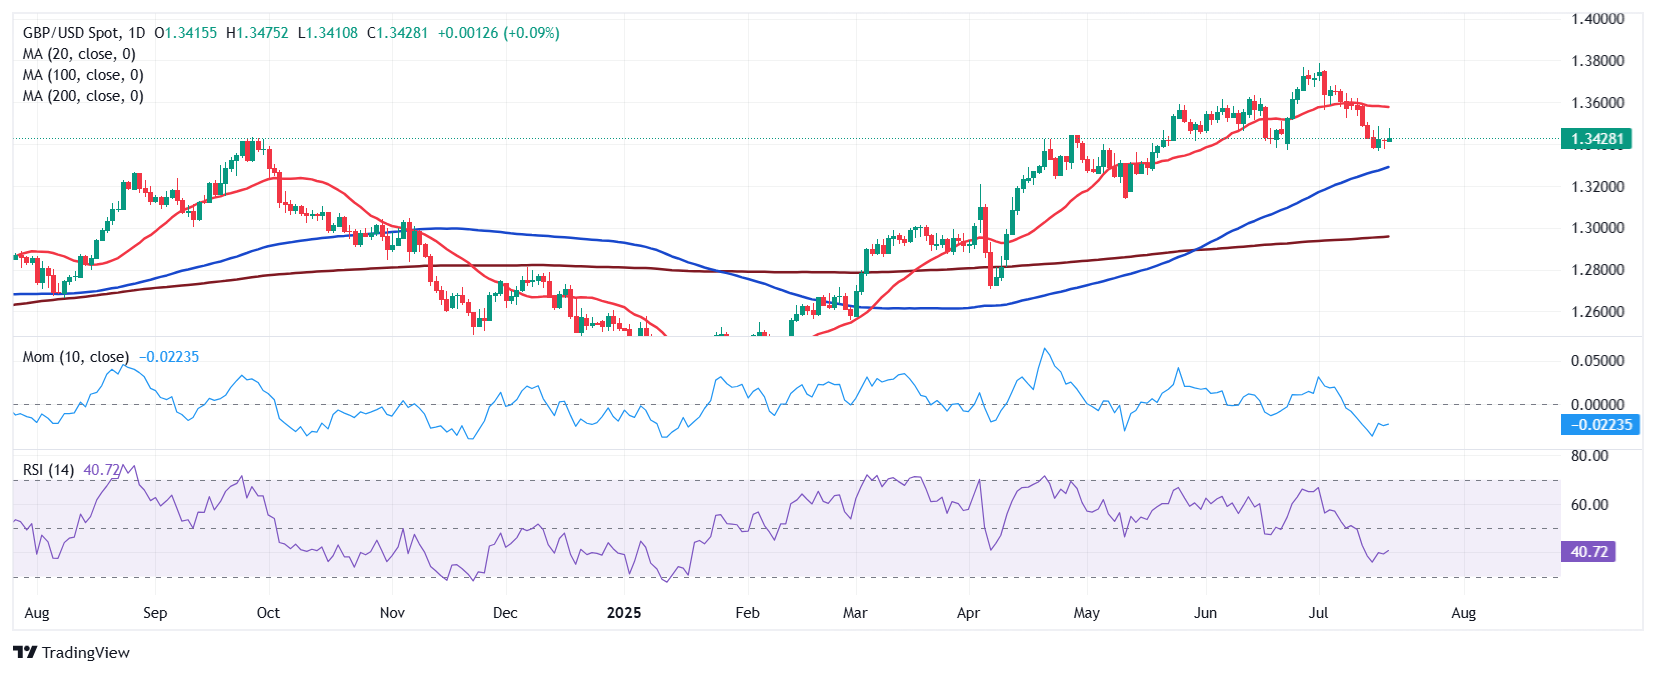
In the daily chart, GBP/USD may have found an interim bottom, yet needs to recover past 1.3500 to confirm so. The pair is holding above a bullish 100 SMA, while the 20 SMA lies flat above the current level. Technical indicators, in the meantime, turned flat within negative levels, and slowly ground higher.
Beyond 1.3500, the recovery could initially extend towards 1.3620, while beyond the latter, GBP/USD could retest its recent highs in the 1.3730 region. A slide through 1.3360, on the other hand, exposes the 1.3300 threshold, en route to the 1.3220 price zone.
Information on these pages contains forward-looking statements that involve risks and uncertainties. Markets and instruments profiled on this page are for informational purposes only and should not in any way come across as a recommendation to buy or sell in these assets. You should do your own thorough research before making any investment decisions. FXStreet does not in any way guarantee that this information is free from mistakes, errors, or material misstatements. It also does not guarantee that this information is of a timely nature. Investing in Open Markets involves a great deal of risk, including the loss of all or a portion of your investment, as well as emotional distress. All risks, losses and costs associated with investing, including total loss of principal, are your responsibility. The views and opinions expressed in this article are those of the authors and do not necessarily reflect the official policy or position of FXStreet nor its advertisers. The author will not be held responsible for information that is found at the end of links posted on this page.
If not otherwise explicitly mentioned in the body of the article, at the time of writing, the author has no position in any stock mentioned in this article and no business relationship with any company mentioned. The author has not received compensation for writing this article, other than from FXStreet.
FXStreet and the author do not provide personalized recommendations. The author makes no representations as to the accuracy, completeness, or suitability of this information. FXStreet and the author will not be liable for any errors, omissions or any losses, injuries or damages arising from this information and its display or use. Errors and omissions excepted.
The author and FXStreet are not registered investment advisors and nothing in this article is intended to be investment advice.