
- GBP/USD is down 0.21% to 1.3545 as US PPI surges 0.9% MoM and 3.3% YoY in July, while Core PPI jumps to 3.7%.
- US Jobless Claims beat forecasts at 224K, with Continuing Claims dipping to 1.953M.
- Fed rate cut expectations for September hold at 25 bps, but 50 bps odds are erased.
The GBP/USD pair retreats during the North American session, down 0.21% after a hot inflation report in the United States (US) prompted traders to pare rate cut bets by the Federal Reserve (Fed) at the September meeting. At the time of writing, the pair trades at 1.3545 after hitting a daily peak of 1.3594.
Sterling retreats from 1.3594 peak after stronger US producer prices and solid jobless claims fuel Dollar rebound
The Producer Price Index (PPI) in the US rose 0.9% MoM in July, up from 0% in the previous month. However, the yearly reading rose 3.3%, exceeding forecasts of 2.5%, up from 2.3% of June’s print. Core PPI, which is used to calculate the Personal Consumption Expenditures (PCE) Price Index, soared 3.7% for the same period on an annual basis, crushing the prior month’s 2.6% jump.
The report shows that companies are indeed passing the tariff impact to customers. Further data provided a boost to the US Dollar as Initial Jobless Claims for the week ending August 9 came at 224K, below forecasts of 228K and the previous print of 227K. Continuing Claims, which sounded the alarm that the jobs market is cooling, dipped from 1.968 million to 1.953 million in the previous week.
Despite the data, investors seem convinced that the Fed will cut interest rates by 25 basis points at the September meeting. However, odds for 50 bps cuts have been erased, and other investors have increased the odds that the central bank will hold rates unchanged.
Regarding UK data, Gross Domestic Product (GDP) figures show the economy slowed less than expected in Q2, with a growth of 0.3% QoQ, down from 0.7% in Q1 but exceeding forecasts of 0.1%.
This report, along with the latest jobs report and inflation figures, increased investors’ fears of a stagflation scenario in the UK, exerting pressure on the Bank of England (BoE). For the September meeting, the BoE is expected to hold rates steady at 4.25%.
Up next, the US economic docket will feature Retail Sales and the University of Michigan Consumer Sentiment. The UK schedule is empty, though traders’ focus shifts to the August 20 CPI figures for June.
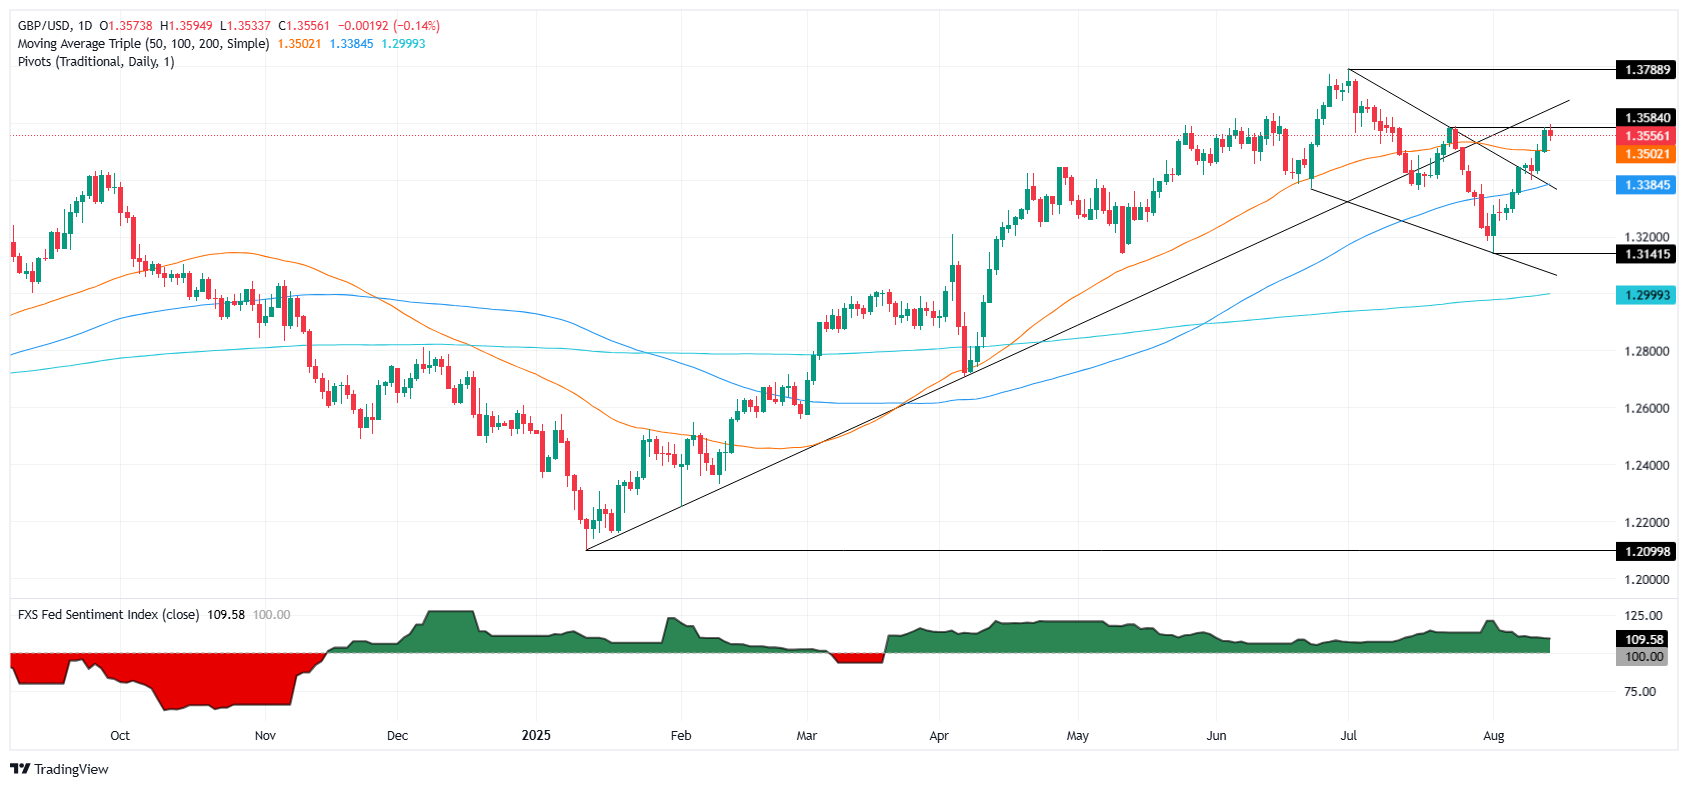
GBP/USD Price Forecast: Technical outlook
GBP/USD trimmed some of its weekly gains, but it remains above key support seen at the 20-day SMA of 1.3498, which could act as a magnet for sellers. Overhead lies the first line of defense for bulls at 1.3500 and 1.3550. If the latter holds, the major could be trading sideways within the 1.3550-1.3600 range.
However, if bulls climb above 1.3600, they could test the July 4 cycle high at 1.3681, shy of 1.3700.
British Pound PRICE This week
The table below shows the percentage change of British Pound (GBP) against listed major currencies this week. British Pound was the strongest against the New Zealand Dollar.
| USD | EUR | GBP | JPY | CAD | AUD | NZD | CHF | |
|---|---|---|---|---|---|---|---|---|
| USD | -0.13% | -0.79% | -0.04% | 0.27% | 0.32% | 0.50% | -0.19% | |
| EUR | 0.13% | -0.67% | 0.10% | 0.41% | 0.45% | 0.58% | -0.05% | |
| GBP | 0.79% | 0.67% | 0.72% | 1.08% | 1.12% | 1.26% | 0.62% | |
| JPY | 0.04% | -0.10% | -0.72% | 0.34% | 0.40% | 0.61% | 0.00% | |
| CAD | -0.27% | -0.41% | -1.08% | -0.34% | 0.07% | 0.18% | -0.48% | |
| AUD | -0.32% | -0.45% | -1.12% | -0.40% | -0.07% | 0.13% | -0.50% | |
| NZD | -0.50% | -0.58% | -1.26% | -0.61% | -0.18% | -0.13% | -0.63% | |
| CHF | 0.19% | 0.05% | -0.62% | -0.01% | 0.48% | 0.50% | 0.63% |
The heat map shows percentage changes of major currencies against each other. The base currency is picked from the left column, while the quote currency is picked from the top row. For example, if you pick the British Pound from the left column and move along the horizontal line to the US Dollar, the percentage change displayed in the box will represent GBP (base)/USD (quote).
Information on these pages contains forward-looking statements that involve risks and uncertainties. Markets and instruments profiled on this page are for informational purposes only and should not in any way come across as a recommendation to buy or sell in these assets. You should do your own thorough research before making any investment decisions. FXStreet does not in any way guarantee that this information is free from mistakes, errors, or material misstatements. It also does not guarantee that this information is of a timely nature. Investing in Open Markets involves a great deal of risk, including the loss of all or a portion of your investment, as well as emotional distress. All risks, losses and costs associated with investing, including total loss of principal, are your responsibility. The views and opinions expressed in this article are those of the authors and do not necessarily reflect the official policy or position of FXStreet nor its advertisers. The author will not be held responsible for information that is found at the end of links posted on this page.
If not otherwise explicitly mentioned in the body of the article, at the time of writing, the author has no position in any stock mentioned in this article and no business relationship with any company mentioned. The author has not received compensation for writing this article, other than from FXStreet.
FXStreet and the author do not provide personalized recommendations. The author makes no representations as to the accuracy, completeness, or suitability of this information. FXStreet and the author will not be liable for any errors, omissions or any losses, injuries or damages arising from this information and its display or use. Errors and omissions excepted.
The author and FXStreet are not registered investment advisors and nothing in this article is intended to be investment advice.