
- GBP/USD up 0.56% after rebounding from 1.3487 lows amid broad USD weakness.
- US July CPI steady at 2.7% YoY and Core CPI jumps to 3.1%, but markets shrug it off.
- Fed cut odds for September meeting surge to 97.85%, with calls for deeper easing from Trump officials.
- US Treasury Secretary Bessent urges the Fed to cut rates by 50 bps in September, followed by further easing.
The GBP/USD pair advances during the North American session, up by 0.56% as the US Dollar (USD) gets battered amid increasing bets that the Federal Reserve (Fed) might resume its easing cycle as soon as September. The pair trades at 1.3572 after bouncing off lows of 1.3487.
Sterling climbs to 1.3572 as markets price nearly 98% odds of September Fed easing
The latest inflation report in the United States (US) revealed that headline inflation was unchanged in July at 2.7% YoY from June’s print. Excluding volatile items, prices jumped above the 3% threshold to 3.1% YoY, though market participants mainly ignored it. After the data, Fed interest rate probabilities show that market players had priced in a 97.85% chance of a cut at the upcoming meeting.
Across the pond, the latest jobs report was not as bad as expected, though it hinted at a cooling labor market. This relieved Bank of England (BoE) policymakers, who are battling higher inflation readings, as the economy slows down. On Thursday, UK Gross Domestic Product (GDP) figures are expected to dip from 1.3% to 1% YoY. Every quarter, the economy is projected to slow from 0.7% to 0.1%.
The US economic schedule will feature the Producer Price Index (PPI) and Initial Jobless Claims data on Thursday. PPI on an annual basis is projected to rise from 2.3% to 2.5% YoY, and Core PPI is foreseen to rise from 2.6% to 2.9% in the twelve months to July.
In the meantime, the US Treasury Secretary Scott Bessent said that the Fed should go into a series of rate cuts, “starting with a 50 basis-point rate cut in September,” said in a Bloomberg interview. He added that rates should be “150, 175 basis points lower.”
Therefore, the Trump administration continues to exert pressure on the Fed Chair Jerome Powell and Co. to lower rates, although prices remain above the Fed’s 2% goal.
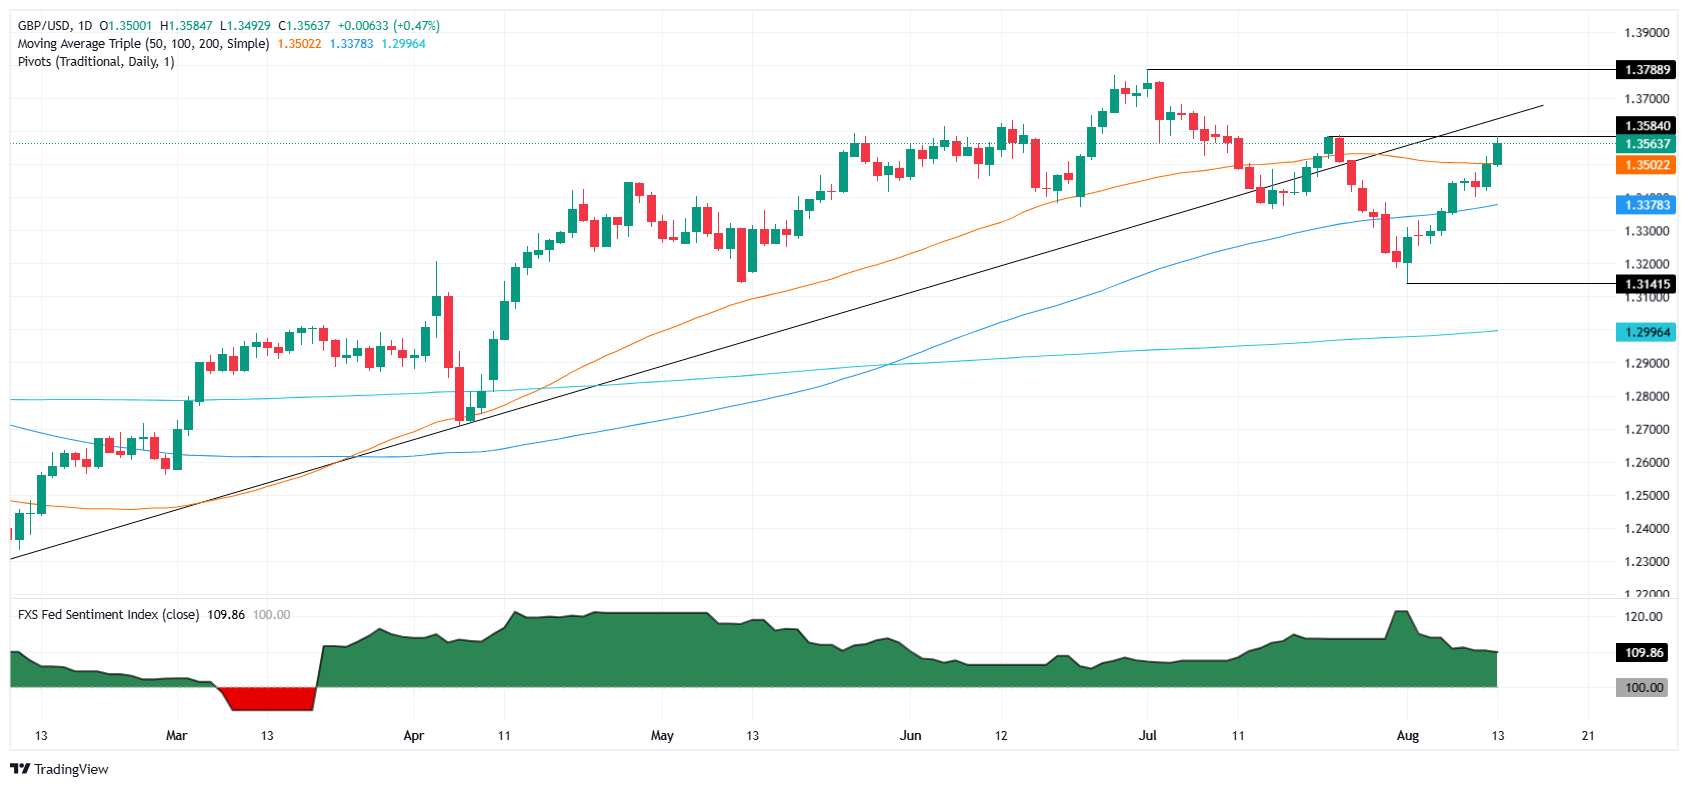
GBP/USD Price Forecast: Technical outlook
After clearing the 200-day Simple Moving Average (SMA) of 1.3498, 1.3500 and the top trendline of a falling wedge, buyers seem in control as they gain momentum. The Relative Strength Index (RSI) is bullish, trending up, further confirming the GBP/USD bullish bias.
The next area of interest would be 1.3600. If surpassed, the next stop would be the July 4 swing high of 1.3681, followed by 1.3700. Conversely, if GBP/USD dives below 1.3550, sellers could drive the exchange rate to 1.3500 and test the 200-day SMA once more. Further downside is seen at the 20-day SMA at 1.3403.
British Pound PRICE This week
The table below shows the percentage change of British Pound (GBP) against listed major currencies this week. British Pound was the strongest against the Canadian Dollar.
| USD | EUR | GBP | JPY | CAD | AUD | NZD | CHF | |
|---|---|---|---|---|---|---|---|---|
| USD | -0.55% | -0.84% | -0.22% | 0.13% | -0.29% | -0.27% | -0.52% | |
| EUR | 0.55% | -0.30% | 0.34% | 0.69% | 0.27% | 0.23% | 0.03% | |
| GBP | 0.84% | 0.30% | 0.58% | 0.99% | 0.56% | 0.54% | 0.34% | |
| JPY | 0.22% | -0.34% | -0.58% | 0.38% | -0.04% | 0.01% | -0.16% | |
| CAD | -0.13% | -0.69% | -0.99% | -0.38% | -0.41% | -0.45% | -0.67% | |
| AUD | 0.29% | -0.27% | -0.56% | 0.04% | 0.41% | -0.03% | -0.24% | |
| NZD | 0.27% | -0.23% | -0.54% | -0.01% | 0.45% | 0.03% | -0.19% | |
| CHF | 0.52% | -0.03% | -0.34% | 0.16% | 0.67% | 0.24% | 0.19% |
The heat map shows percentage changes of major currencies against each other. The base currency is picked from the left column, while the quote currency is picked from the top row. For example, if you pick the British Pound from the left column and move along the horizontal line to the US Dollar, the percentage change displayed in the box will represent GBP (base)/USD (quote).
Information on these pages contains forward-looking statements that involve risks and uncertainties. Markets and instruments profiled on this page are for informational purposes only and should not in any way come across as a recommendation to buy or sell in these assets. You should do your own thorough research before making any investment decisions. FXStreet does not in any way guarantee that this information is free from mistakes, errors, or material misstatements. It also does not guarantee that this information is of a timely nature. Investing in Open Markets involves a great deal of risk, including the loss of all or a portion of your investment, as well as emotional distress. All risks, losses and costs associated with investing, including total loss of principal, are your responsibility. The views and opinions expressed in this article are those of the authors and do not necessarily reflect the official policy or position of FXStreet nor its advertisers. The author will not be held responsible for information that is found at the end of links posted on this page.
If not otherwise explicitly mentioned in the body of the article, at the time of writing, the author has no position in any stock mentioned in this article and no business relationship with any company mentioned. The author has not received compensation for writing this article, other than from FXStreet.
FXStreet and the author do not provide personalized recommendations. The author makes no representations as to the accuracy, completeness, or suitability of this information. FXStreet and the author will not be liable for any errors, omissions or any losses, injuries or damages arising from this information and its display or use. Errors and omissions excepted.
The author and FXStreet are not registered investment advisors and nothing in this article is intended to be investment advice.