EUR/USD Current price: 1.1631
- Dismal United States data fueled demand for the USD early in the American session.
- Market participants await the US ISM Services Purchasing Managers’ Index.
- EUR/USD is under mild selling pressure, strong support at 1.1590.
The EUR/USD pair spent the first half of the day confined to a tight intraday range, stuck around the 1.1650 area. The US Dollar (USD) pushed marginally higher against most major rivals amid continued caution among market participants ahead of United States (US) macro releases.
Meanwhile, the Euro (EU) had no reason to advance. Eurozone Retail Sales were down 0.5% in July, easing from the 0.6% gain posted in June and worse than the -0.2% anticipated by market participants. Retail Sales annual gain was 2.2%, below the 2.4% forecast and the previous 3.5%.
The first batch of US data was pretty discouraging. The country released August Challenger Job Cuts, which showed that US-based employers announced 85,979 job cuts in August, up 39% from the 62,075 figure announced in July, and the highest monthly reading since 2020. Also, the ADP Employment Change report showed that the private sector added a modest 54,000 new job positions in the same month, much worse than the revised 106,000 from July and worse than the 65,000 anticipated.
Initial Jobless Claims for the week ended August 31 rose to 237,000 from the previous 229,000 and worse than the 230,000 expected, while the July Goods and Services Trade Balance posted a deficit of $ 78.3 billion, worsening from $60.2 billion in June. Finally, Nonfarm Productivity in Q2 rose by 3.3%, better than the 2.4% expected, while Unit Labor Cost in the same period was up 1%.
The USD found fresh bids with the news, pushing EUR/USD towards the fresh daily lows in the 1.1630 price zone. Coming up next is the ISM Services Purchasing Managers’ Index (PMI), foreseen at 51 in August, better than the 50.1 posted in July.
EUR/USD short-term technical outlook
The daily chart for the EUR/USD pair shows the risk remains skewed to the downside. A flat 20 Simple Moving Average (SMA) at around 1.1665 keeps providing resistance and containing advances, while technical indicators grind lower right below their midlines. The 100 SMA keeps losing its bullish strength, turning flat at around 1.1520 and becoming a potential target should the USD extend its advance.
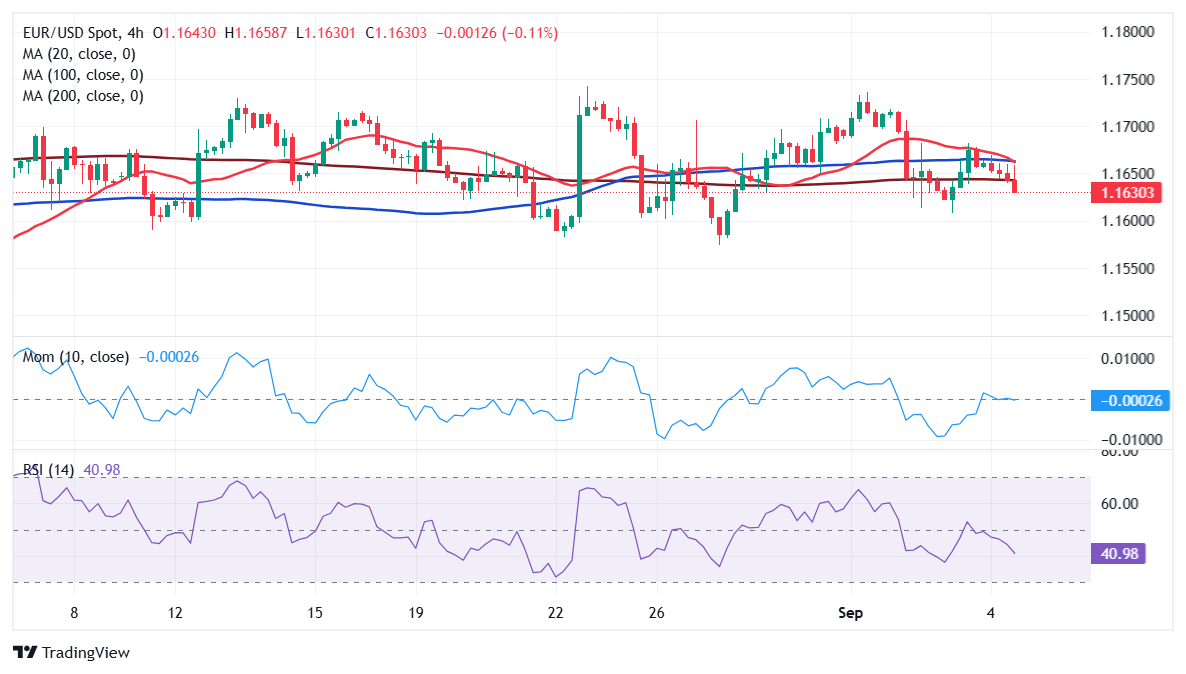
The near-term picture is bearish. In the 4-hour chart, EUR/USD is developing below all its moving averages, which, anyway, remain confined to a tight range. The 20 SMA gains downward traction above directionless longer ones, usually a sign of increasing selling interest. Finally, technical indicators gain downward traction within negative levels, in line with lower lows ahead.
Support levels: 1.1620 1.1590 1.1550
Resistance levels: 1.1665 1.1700 1.1745
Information on these pages contains forward-looking statements that involve risks and uncertainties. Markets and instruments profiled on this page are for informational purposes only and should not in any way come across as a recommendation to buy or sell in these assets. You should do your own thorough research before making any investment decisions. FXStreet does not in any way guarantee that this information is free from mistakes, errors, or material misstatements. It also does not guarantee that this information is of a timely nature. Investing in Open Markets involves a great deal of risk, including the loss of all or a portion of your investment, as well as emotional distress. All risks, losses and costs associated with investing, including total loss of principal, are your responsibility. The views and opinions expressed in this article are those of the authors and do not necessarily reflect the official policy or position of FXStreet nor its advertisers. The author will not be held responsible for information that is found at the end of links posted on this page.
If not otherwise explicitly mentioned in the body of the article, at the time of writing, the author has no position in any stock mentioned in this article and no business relationship with any company mentioned. The author has not received compensation for writing this article, other than from FXStreet.
FXStreet and the author do not provide personalized recommendations. The author makes no representations as to the accuracy, completeness, or suitability of this information. FXStreet and the author will not be liable for any errors, omissions or any losses, injuries or damages arising from this information and its display or use. Errors and omissions excepted.
The author and FXStreet are not registered investment advisors and nothing in this article is intended to be investment advice.