EUR/USD Current price: 1.1648
- The United States Consumer Price Index rose by 2.7% in June as expected.
- Germany upwardly revised the June Harmonized Index of Consumer Prices.
- EUR/USD is technically bearish in the near term, and could fall towards 1.1590.
The EUR/USD pair trades with a soft tone in the 1.1640 region, with the US Dollar entering the American session with moderate strength. The Greenback suffered a short-lived downturn following the release of United States (US) inflation figures.
The US had an annual inflation rate of 2.7% in June when tracked by the Consumer Price Index (CPI), an increase from 2.4% in May, while the core annual reading increased by 2.9%, up from May’s 2.8% rise. Finally, the monthly CPI increased by 0.3%, while the core monthly reading printed at 0.2%.
The figures had a limited impact on future Federal Reserve (Fed) decisions, yet positively affected the market mood, with stocks rising despite underlying tariff-related concerns.
Other than that, Germany released the ZEW survey on Economic Sentiment, which improved to 52.7 in July from 47.5 in the previous month. The EU Economic Sentiment in the same period improved by less than anticipated, hitting 36.1, up from the 35.3 posted in June but below the 37.8 anticipated.
Finally, Germany reported that inflation was higher than previously estimated in June, as the Harmonized Index on Consumer Prices (HICP) was revised to 2.3% YoY from 2.2%.
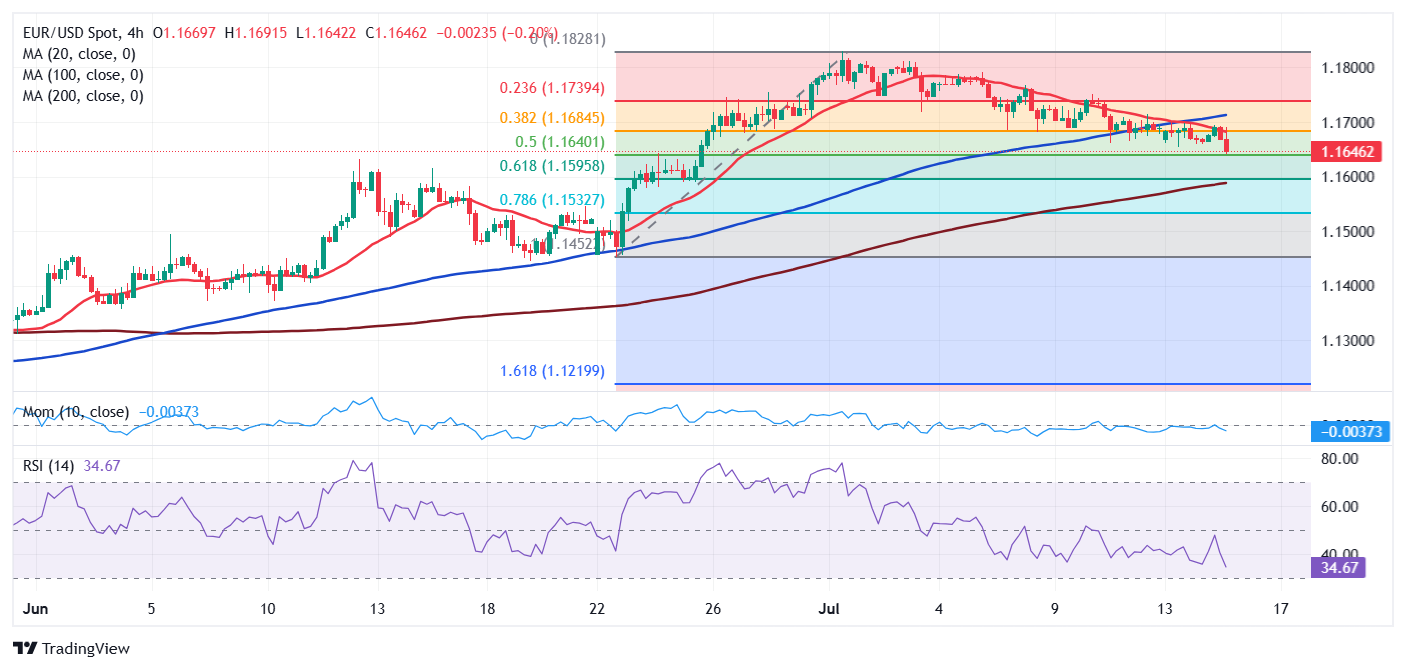
EUR/USD short-term technical outlook
The daily chart for the EUR/USD pair shows it holds between familiar levels for a second consecutive day, although with sellers holding the grip. The pair trades a handful of pips below a mildly bullish 20 Simple Moving Average (SMA), currently at around 1.1670. However, the 100 SMA maintains its bullish slope well below the current level. Technical indicators, in the meantime, extend their downward slopes and are currently piercing their midlines.
The 4-hour chart shows that technical indicators accelerated lower within negative levels, reflecting increased selling interest, while a bearish 20 SMA extends its slide below the 100 SMA, providing dynamic resistance. The pair is currently pressuring the 50% Fibonacci retracement of the latest June advance at around 1.1645, with the next relevant support coming at around 1.1595.
Support levels: 1.1645 1.1595 1.1560
Resistance levels: 1.1585 1.1725 1.1770
Information on these pages contains forward-looking statements that involve risks and uncertainties. Markets and instruments profiled on this page are for informational purposes only and should not in any way come across as a recommendation to buy or sell in these assets. You should do your own thorough research before making any investment decisions. FXStreet does not in any way guarantee that this information is free from mistakes, errors, or material misstatements. It also does not guarantee that this information is of a timely nature. Investing in Open Markets involves a great deal of risk, including the loss of all or a portion of your investment, as well as emotional distress. All risks, losses and costs associated with investing, including total loss of principal, are your responsibility. The views and opinions expressed in this article are those of the authors and do not necessarily reflect the official policy or position of FXStreet nor its advertisers. The author will not be held responsible for information that is found at the end of links posted on this page.
If not otherwise explicitly mentioned in the body of the article, at the time of writing, the author has no position in any stock mentioned in this article and no business relationship with any company mentioned. The author has not received compensation for writing this article, other than from FXStreet.
FXStreet and the author do not provide personalized recommendations. The author makes no representations as to the accuracy, completeness, or suitability of this information. FXStreet and the author will not be liable for any errors, omissions or any losses, injuries or damages arising from this information and its display or use. Errors and omissions excepted.
The author and FXStreet are not registered investment advisors and nothing in this article is intended to be investment advice.