
- EUR/USD trades modestly lower on the day below 1.1700.
- Producer inflation and weekly Jobless Claims data will be featured in the US economic calendar.
- The near-term technical outlook points to a loss of bullish momentum.
EUR/USD seems to have entered a consolidation phase below 1.1700 after closing marginally higher on Wednesday. July producer inflation data from the US, alongside weekly Initial Jobless Claims, could drive the pair’s action in the second half of the day.
Euro PRICE This week
The table below shows the percentage change of Euro (EUR) against listed major currencies this week. Euro was the strongest against the Canadian Dollar.
| USD | EUR | GBP | JPY | CAD | AUD | NZD | CHF | |
|---|---|---|---|---|---|---|---|---|
| USD | -0.30% | -0.93% | -0.67% | 0.16% | -0.14% | 0.09% | -0.26% | |
| EUR | 0.30% | -0.64% | -0.38% | 0.47% | 0.15% | 0.34% | 0.05% | |
| GBP | 0.93% | 0.64% | 0.22% | 1.12% | 0.80% | 0.99% | 0.69% | |
| JPY | 0.67% | 0.38% | -0.22% | 0.88% | 0.58% | 0.84% | 0.57% | |
| CAD | -0.16% | -0.47% | -1.12% | -0.88% | -0.29% | -0.12% | -0.44% | |
| AUD | 0.14% | -0.15% | -0.80% | -0.58% | 0.29% | 0.20% | -0.11% | |
| NZD | -0.09% | -0.34% | -0.99% | -0.84% | 0.12% | -0.20% | -0.30% | |
| CHF | 0.26% | -0.05% | -0.69% | -0.57% | 0.44% | 0.11% | 0.30% |
The heat map shows percentage changes of major currencies against each other. The base currency is picked from the left column, while the quote currency is picked from the top row. For example, if you pick the Euro from the left column and move along the horizontal line to the US Dollar, the percentage change displayed in the box will represent EUR (base)/USD (quote).
In the absence of high-tier data releases, the US Dollar (USD) struggled to find demand on Wednesday as risk flows continued to dominate the action in financial markets following the record-setting rally seen in Wall Street’s main indexes on Tuesday.
In the European morning on Thursday, US stock index futures trade mixed, pointing to a cautious market mood, which helps the USD hold its ground.
On a yearly basis, the Producer Price Index (PPI) in the US is forecast to rise by 2.5% in July, up from the 2.3% increase recorded in June. A softer-than-expected print in this data could weigh on the USD with the immediate reaction.
On the other hand, the USD could stay resilient against its rivals if the weekly data published by the US Department of Labor shows that the number of first-time applications for unemployment benefits were less than 210,000 in the week ending August 9.
EUR/USD Technical Analysis
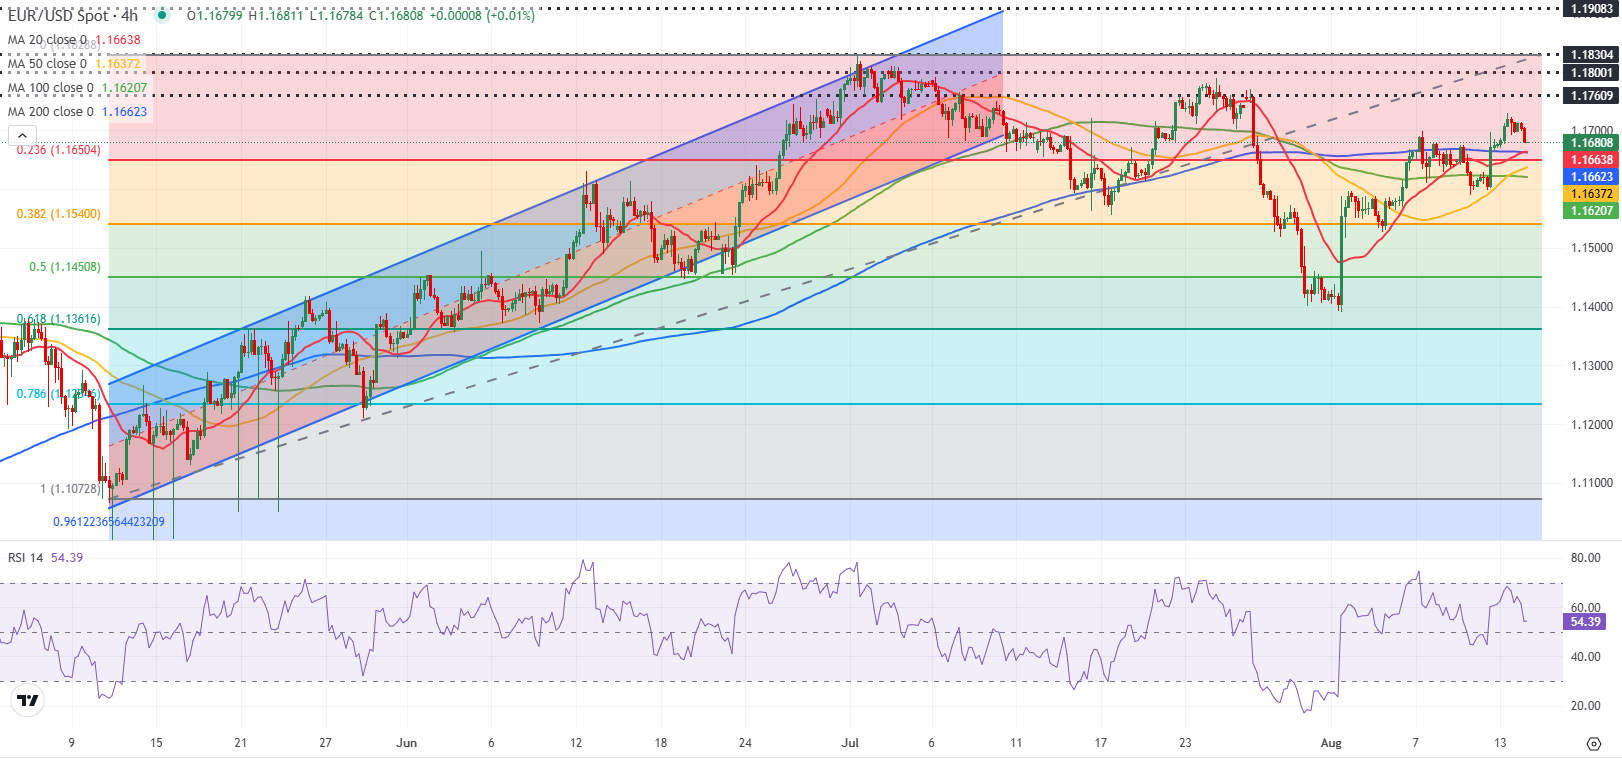
The Relative Strength Index (RSI) indicator on the 4-hour chart declines toward 50 early Thursday, pointing to a loss of bullish momentum.
In case EUR/USD drops below the 1.1660-1.1650 area, where the 200-period Simple Moving Average (SMA) and the Fibonacci 23.6% retracement of the latest uptrend align, and starts using this region as resistance, technical sellers could take action. In this scenario, 1.1620 (100-period SMA) could be seen as the next support ahead of 1.1600 (static level, round level) and 1.1540 (Fibonacci 38.2% retracement).
On the upside, resistance levels could be seen at 1.1720 (static level), 1.1760 (static level) and 1.1800 (static level, round level).
Euro FAQs
The Euro is the currency for the 19 European Union countries that belong to the Eurozone. It is the second most heavily traded currency in the world behind the US Dollar. In 2022, it accounted for 31% of all foreign exchange transactions, with an average daily turnover of over $2.2 trillion a day. EUR/USD is the most heavily traded currency pair in the world, accounting for an estimated 30% off all transactions, followed by EUR/JPY (4%), EUR/GBP (3%) and EUR/AUD (2%).
The European Central Bank (ECB) in Frankfurt, Germany, is the reserve bank for the Eurozone. The ECB sets interest rates and manages monetary policy. The ECB’s primary mandate is to maintain price stability, which means either controlling inflation or stimulating growth. Its primary tool is the raising or lowering of interest rates. Relatively high interest rates – or the expectation of higher rates – will usually benefit the Euro and vice versa. The ECB Governing Council makes monetary policy decisions at meetings held eight times a year. Decisions are made by heads of the Eurozone national banks and six permanent members, including the President of the ECB, Christine Lagarde.
Eurozone inflation data, measured by the Harmonized Index of Consumer Prices (HICP), is an important econometric for the Euro. If inflation rises more than expected, especially if above the ECB’s 2% target, it obliges the ECB to raise interest rates to bring it back under control. Relatively high interest rates compared to its counterparts will usually benefit the Euro, as it makes the region more attractive as a place for global investors to park their money.
Data releases gauge the health of the economy and can impact on the Euro. Indicators such as GDP, Manufacturing and Services PMIs, employment, and consumer sentiment surveys can all influence the direction of the single currency. A strong economy is good for the Euro. Not only does it attract more foreign investment but it may encourage the ECB to put up interest rates, which will directly strengthen the Euro. Otherwise, if economic data is weak, the Euro is likely to fall. Economic data for the four largest economies in the euro area (Germany, France, Italy and Spain) are especially significant, as they account for 75% of the Eurozone’s economy.
Another significant data release for the Euro is the Trade Balance. This indicator measures the difference between what a country earns from its exports and what it spends on imports over a given period. If a country produces highly sought after exports then its currency will gain in value purely from the extra demand created from foreign buyers seeking to purchase these goods. Therefore, a positive net Trade Balance strengthens a currency and vice versa for a negative balance.
Information on these pages contains forward-looking statements that involve risks and uncertainties. Markets and instruments profiled on this page are for informational purposes only and should not in any way come across as a recommendation to buy or sell in these assets. You should do your own thorough research before making any investment decisions. FXStreet does not in any way guarantee that this information is free from mistakes, errors, or material misstatements. It also does not guarantee that this information is of a timely nature. Investing in Open Markets involves a great deal of risk, including the loss of all or a portion of your investment, as well as emotional distress. All risks, losses and costs associated with investing, including total loss of principal, are your responsibility. The views and opinions expressed in this article are those of the authors and do not necessarily reflect the official policy or position of FXStreet nor its advertisers. The author will not be held responsible for information that is found at the end of links posted on this page.
If not otherwise explicitly mentioned in the body of the article, at the time of writing, the author has no position in any stock mentioned in this article and no business relationship with any company mentioned. The author has not received compensation for writing this article, other than from FXStreet.
FXStreet and the author do not provide personalized recommendations. The author makes no representations as to the accuracy, completeness, or suitability of this information. FXStreet and the author will not be liable for any errors, omissions or any losses, injuries or damages arising from this information and its display or use. Errors and omissions excepted.
The author and FXStreet are not registered investment advisors and nothing in this article is intended to be investment advice.