
- AUD/USD came under extra selling pressure and approached the 0.6500 level.
- The US Dollar picked up further traction following firm US CPI readings in June.
- Chinese GDP figures came in better than expected in the second quarter.
The Australian Dollar (AUD) slipped for a third straight session on Tuesday, with AUD/USD drifting back to the proximity of the key 0.6500 support zone as the risk-off mood dominated the broad sentiment.
RBA: Steady hand or gentle nudge?
Earlier this month, the Reserve Bank of Australia (RBA) surprised markets by holding its cash rate at 3.85%. Six of the nine board members backed that decision, while three favoured a 25‑basis‑point cut, an internal split Governor Michele Bullock described as one of “timing, not direction.”
In addition, Bullock stressed that if inflation lands near forecasts in the second quarter, easing would follow.
So far, futures markets have already priced in roughly a 90% chance of a cut in August while pushing the likely terminal rate higher, from 2.85% to about 3.10%.
China’s mixed signals
Australia’s top trading partner delivered a blend of optimism and caution in its latest set of data releases.
China’s economy experienced a 1.1% expansion in Q2 according to GDP data, compared to the 5.2% YoY growth. This aligns with Beijing’s 2025 growth target of 5%. On the latter, it is worth noting that the target is a political signal rather than an economic one.
China’s industrial sector continued to perform well, with industrial production rising 6.8% YoY. However, consumer spending slowed, with retail sales only growing 4.8% from a year earlier. The country faces structural challenges such as low household incomes, high saving rates, and rising consumer debt burdens, making a consumer-led recovery unlikely.
These data added to June’s trade figures reported earlier in the week, showing a $114.8 billion surplus.
Central‑bank crossroads
Globally, monetary narratives are diverging.
The RBA’s cautious pause mirrors the Federal Reserve’s (Fed) June hold, but Fed Chair Jerome Powell’s warning that US tariffs could reignite goods‑price inflation hints at potential policy splits if either economy sees a fresh inflation surge. The latter appeared somewhat reinforced following the uptick in US inflation in June.
Specs turn bearish
Speculators have been sharpening their short positions against the Aussie. CFTC data for the week to July 8 show net shorts climbed to about 74.3 K contracts, or two‑week highs, with open interest at nearly 153.4 K contracts, marking the fourth straight weekly increase and signalling broad scepticism.
Chart watchers stay cautious
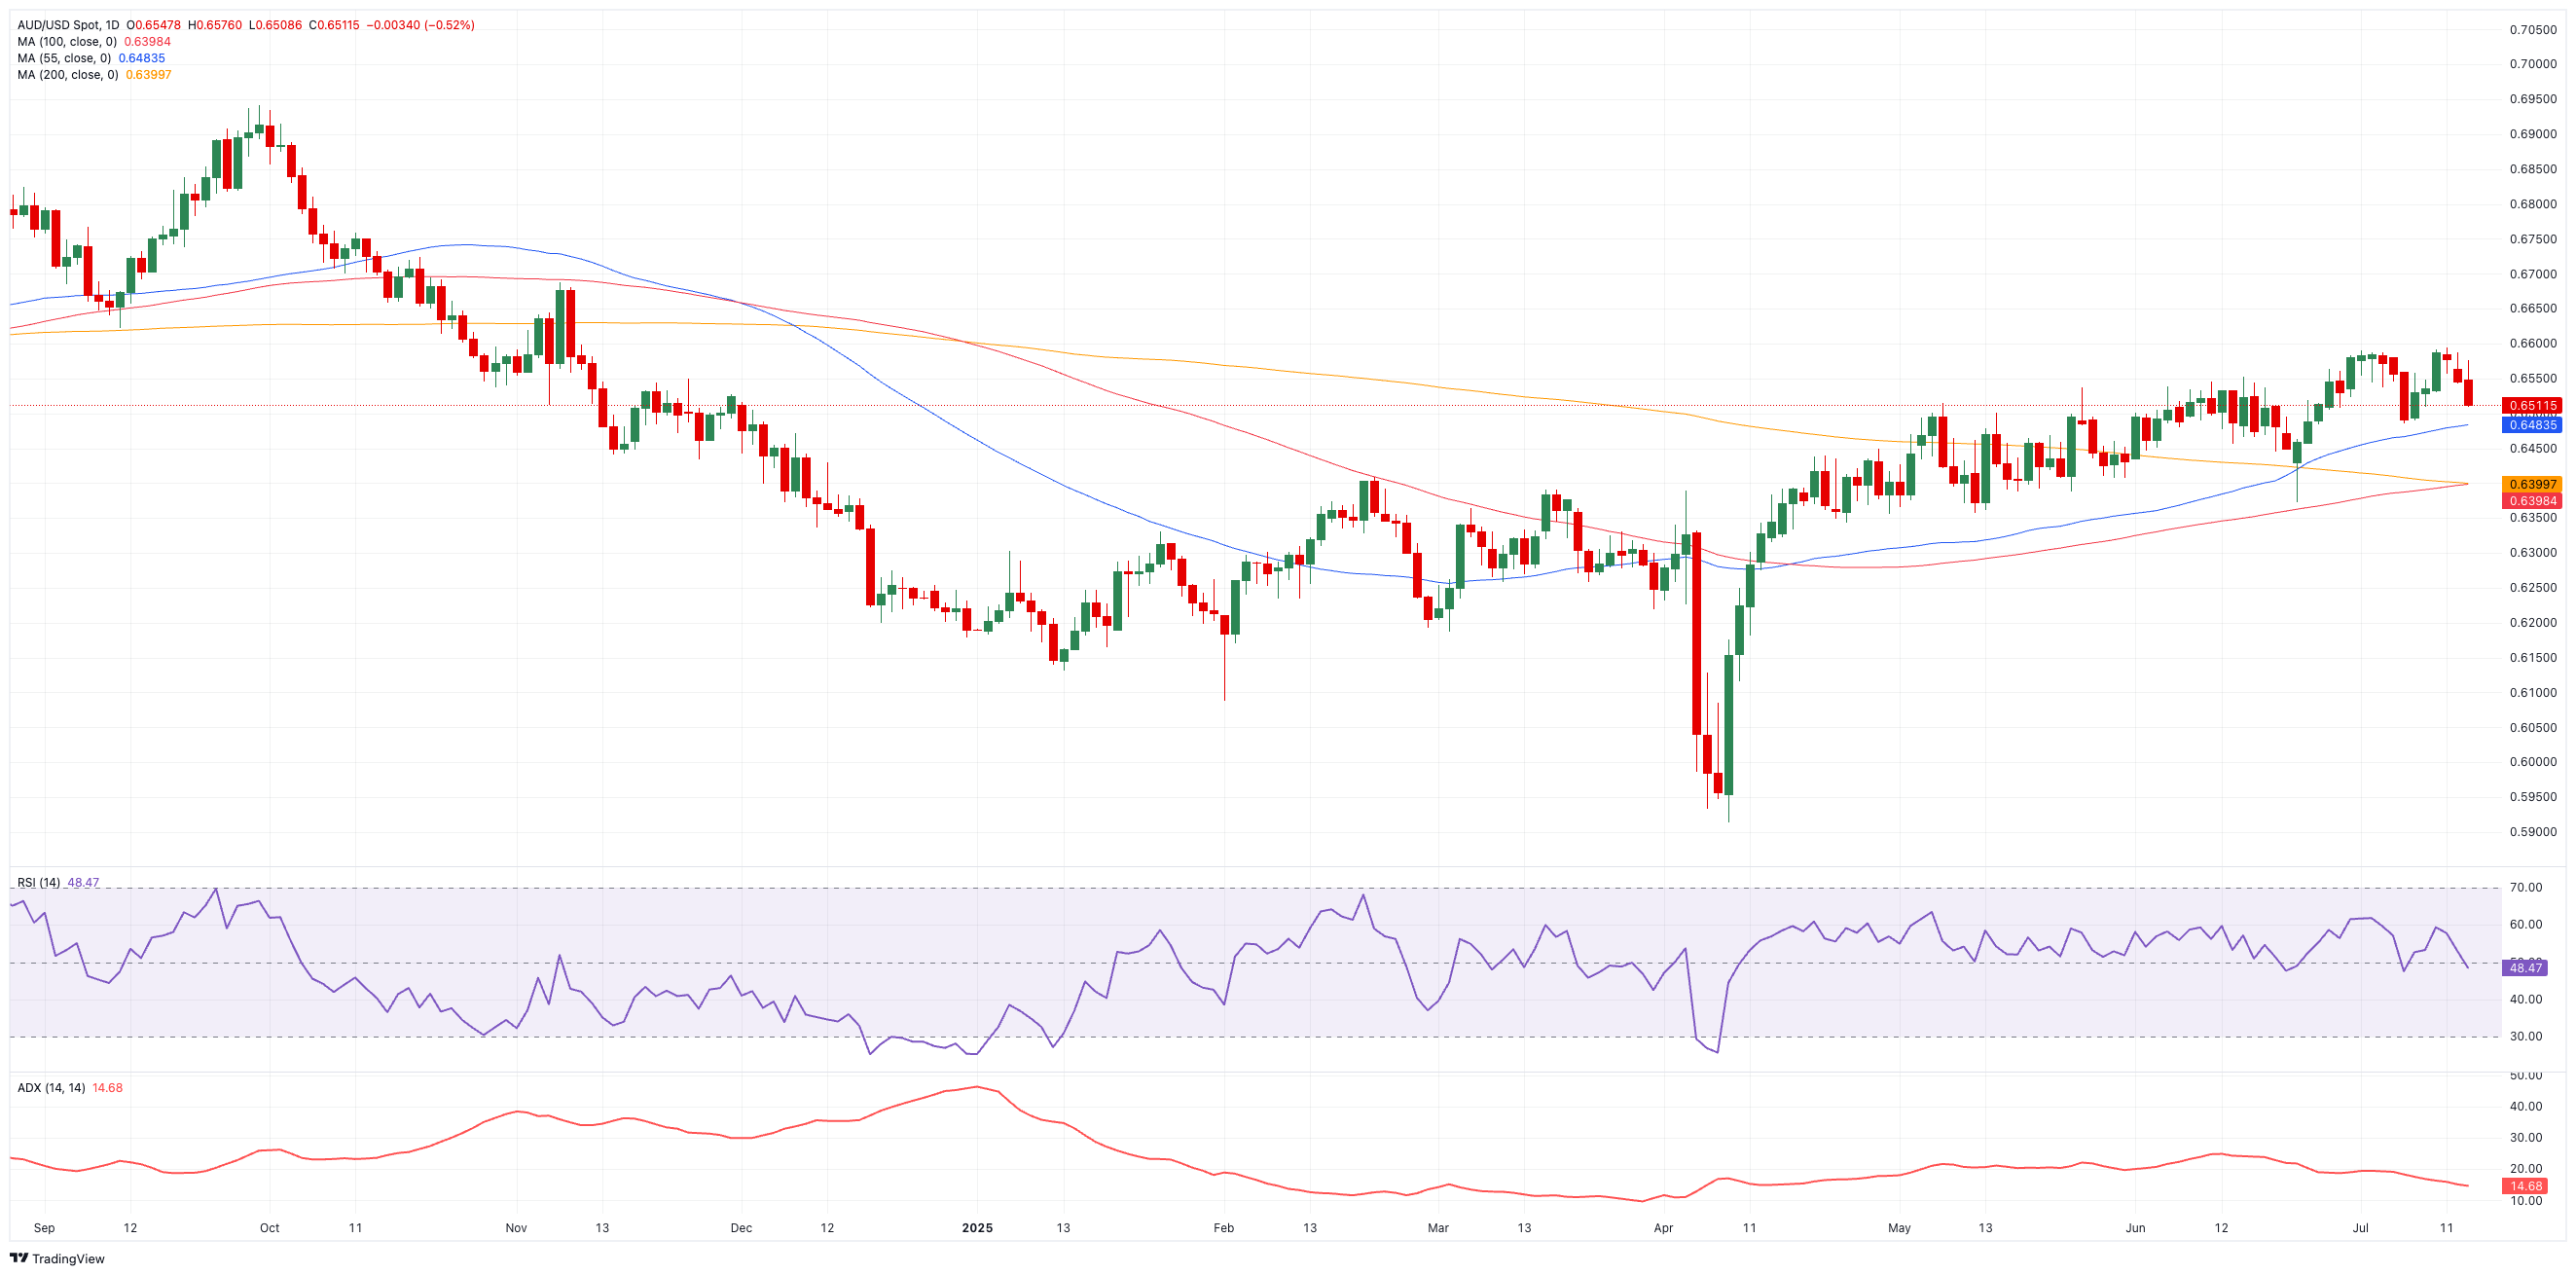
Technically, AUD/USD needs to clear the 2025 high of 0.6590 (June 30) before challenging the November 2024 peak at 0.6687 and, eventually, the round 0.7000 mark.
On the downside, immediate support sits at the July trough of 0.6485 (July 7), then the interim 55‑day SMA at 0.6482, and the 200‑day SMA at 0.6403.
The momentum gauges provide conflicting information: the Relative Strength Index (RSI) has decreased to approximately 49, indicating a potential loss of momentum, while the Average Directional Index (ADX) hovering around 16 indicates a lack of conviction in the current trend.
AUD/USD daily chart
Bottom line
With China’s recovery remaining patchy and both Beijing and Washington still hinting at tweaks to trade policy, the Aussie may stay trapped in its recent range until a clear catalyst emerges. For now, the RBA looks set to remain prudent, signalling that any rate cuts will be gradual rather than aggressive.
Inflation FAQs
Inflation measures the rise in the price of a representative basket of goods and services. Headline inflation is usually expressed as a percentage change on a month-on-month (MoM) and year-on-year (YoY) basis. Core inflation excludes more volatile elements such as food and fuel which can fluctuate because of geopolitical and seasonal factors. Core inflation is the figure economists focus on and is the level targeted by central banks, which are mandated to keep inflation at a manageable level, usually around 2%.
The Consumer Price Index (CPI) measures the change in prices of a basket of goods and services over a period of time. It is usually expressed as a percentage change on a month-on-month (MoM) and year-on-year (YoY) basis. Core CPI is the figure targeted by central banks as it excludes volatile food and fuel inputs. When Core CPI rises above 2% it usually results in higher interest rates and vice versa when it falls below 2%. Since higher interest rates are positive for a currency, higher inflation usually results in a stronger currency. The opposite is true when inflation falls.
Although it may seem counter-intuitive, high inflation in a country pushes up the value of its currency and vice versa for lower inflation. This is because the central bank will normally raise interest rates to combat the higher inflation, which attract more global capital inflows from investors looking for a lucrative place to park their money.
Formerly, Gold was the asset investors turned to in times of high inflation because it preserved its value, and whilst investors will often still buy Gold for its safe-haven properties in times of extreme market turmoil, this is not the case most of the time. This is because when inflation is high, central banks will put up interest rates to combat it. Higher interest rates are negative for Gold because they increase the opportunity-cost of holding Gold vis-a-vis an interest-bearing asset or placing the money in a cash deposit account. On the flipside, lower inflation tends to be positive for Gold as it brings interest rates down, making the bright metal a more viable investment alternative.
Information on these pages contains forward-looking statements that involve risks and uncertainties. Markets and instruments profiled on this page are for informational purposes only and should not in any way come across as a recommendation to buy or sell in these assets. You should do your own thorough research before making any investment decisions. FXStreet does not in any way guarantee that this information is free from mistakes, errors, or material misstatements. It also does not guarantee that this information is of a timely nature. Investing in Open Markets involves a great deal of risk, including the loss of all or a portion of your investment, as well as emotional distress. All risks, losses and costs associated with investing, including total loss of principal, are your responsibility. The views and opinions expressed in this article are those of the authors and do not necessarily reflect the official policy or position of FXStreet nor its advertisers. The author will not be held responsible for information that is found at the end of links posted on this page.
If not otherwise explicitly mentioned in the body of the article, at the time of writing, the author has no position in any stock mentioned in this article and no business relationship with any company mentioned. The author has not received compensation for writing this article, other than from FXStreet.
FXStreet and the author do not provide personalized recommendations. The author makes no representations as to the accuracy, completeness, or suitability of this information. FXStreet and the author will not be liable for any errors, omissions or any losses, injuries or damages arising from this information and its display or use. Errors and omissions excepted.
The author and FXStreet are not registered investment advisors and nothing in this article is intended to be investment advice.