
- GBP/USD edges higher after posting losses for three consecutive days.
- The technical outlook is yet to highlight a buildup of recovery momentum.
- August Manufacturing and Services PMI data will be featured in the US economic calendar.
After dropping to its lowest level in over a week below 1.3450 in the Asian session on Thursday, GBP/USD regained its traction and advanced to the 1.3470 region. Despite this recent recovery, the pair’s technical outlook doesn’t point to an increasing buyer interest.
Pound Sterling Price This week
The table below shows the percentage change of British Pound (GBP) against listed major currencies this week. British Pound was the weakest against the Swiss Franc.
| USD | EUR | GBP | JPY | CAD | AUD | NZD | CHF | |
|---|---|---|---|---|---|---|---|---|
| USD | 0.47% | 0.59% | 0.24% | 0.43% | 1.29% | 1.68% | -0.06% | |
| EUR | -0.47% | 0.11% | -0.26% | -0.04% | 0.83% | 1.17% | -0.52% | |
| GBP | -0.59% | -0.11% | -0.48% | -0.16% | 0.72% | 1.05% | -0.68% | |
| JPY | -0.24% | 0.26% | 0.48% | 0.22% | 1.08% | 1.47% | -0.28% | |
| CAD | -0.43% | 0.04% | 0.16% | -0.22% | 0.84% | 1.24% | -0.52% | |
| AUD | -1.29% | -0.83% | -0.72% | -1.08% | -0.84% | 0.34% | -1.38% | |
| NZD | -1.68% | -1.17% | -1.05% | -1.47% | -1.24% | -0.34% | -1.74% | |
| CHF | 0.06% | 0.52% | 0.68% | 0.28% | 0.52% | 1.38% | 1.74% |
The heat map shows percentage changes of major currencies against each other. The base currency is picked from the left column, while the quote currency is picked from the top row. For example, if you pick the British Pound from the left column and move along the horizontal line to the US Dollar, the percentage change displayed in the box will represent GBP (base)/USD (quote).
The risk-averse market environment caused GBP/USD to continue to stretch lower early Thursday. In the European session, Pound Sterling benefited from the preliminary August Purchasing Managers’ Index (PMI) data from the UK and erased its daily losses.
S&P Global Composite PMI improved to 53 from 51.5 in July, reflecting an ongoing expansion in the private sector’s economic activity at an accelerating pace.
Assessing the PMI survey’s findings, “the flash UK PMI survey for August indicated that the pace of economic growth has continued to accelerate over the summer after a sluggish spring, the rate of expansion now at a one-year high,” noted Chris Williamson, Chief Business Economist at S&P Global Market Intelligence, and added: “The services sector has led the expansion, but manufacturing also showed further signs of stabilising.”
In the second half of the day, the PMI data from the US will be scrutinized by market participants.
S&P Global Manufacturing PMI is expected to decline to 49.5 in August’s preliminary estimate, while the Services PMI is forecast to edge lower to 54.2. In case Manufacturing PMI comes in above 50 and the Services PMI arrives near the market consensus, the immediate reaction could be supportive for the USD.
If the headline PMIs don’t offer any significant surprises, investors could react to comments on the employment and the inflation situation in the private sector. In case the publication suggests that companies are scaling back hiring plans, the USD could come under selling pressure. On the other hand, the USD is likely to gather strength if the PMI report highlights a noticeable increase in input inflation.
GBP/USD Technical Analysis
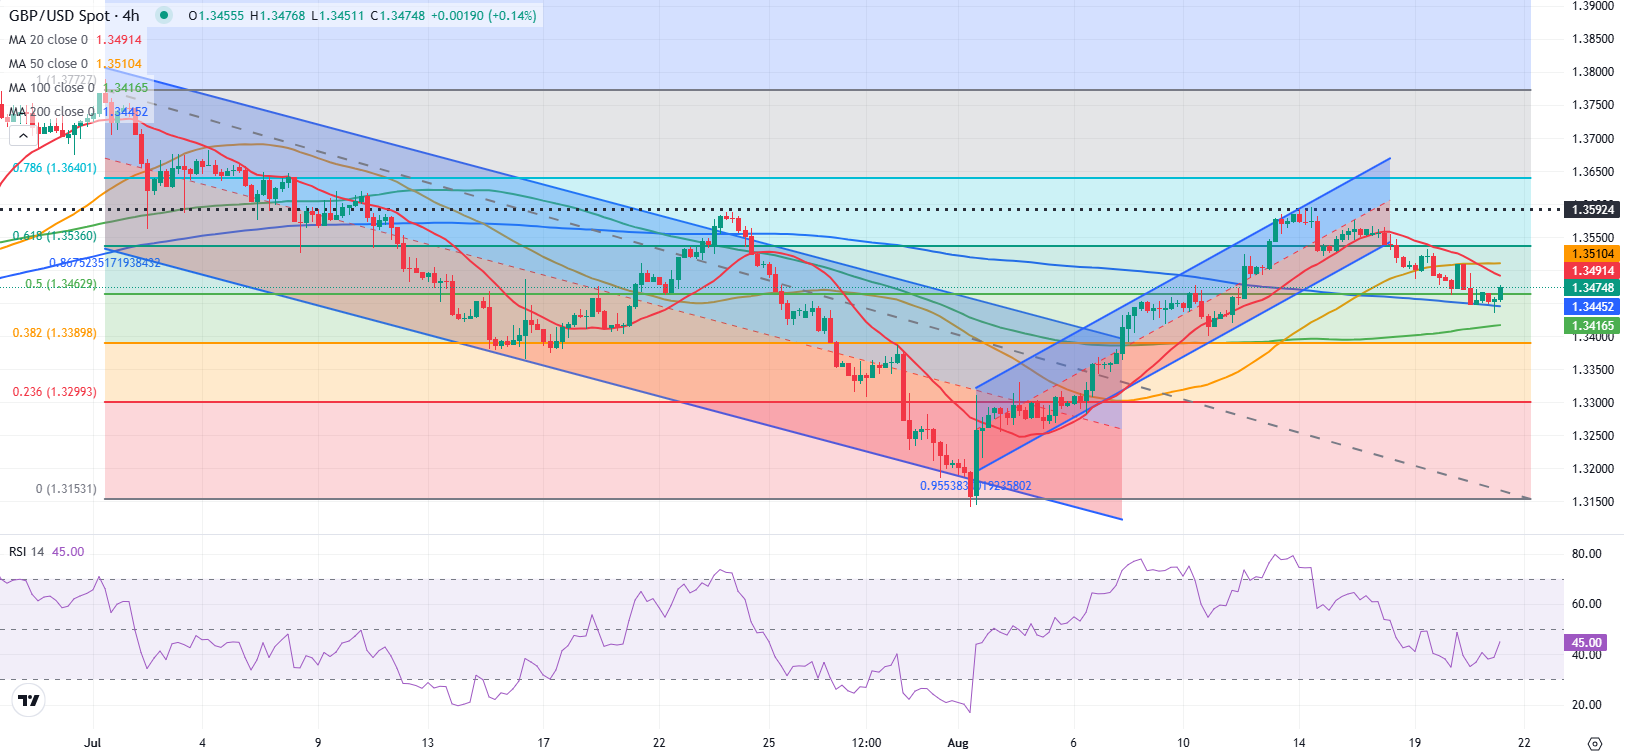
The Relative Strength Index (RSI) indicator on the 4-hour chart is yet to clear 50, reflecting a lack of bullish momentum.
On the upside, 1.3500 (static level, 50-day Simple Moving Average (SMA), round level) aligns as the first resistance level before 1.3540 (Fibonacci 61.8% retracement of the latest downtrend) and 1.3590-1.3600 (static level, round level).
Looking south, the first support level could be spotted at 1.3415-1.3400 (Fibonacci 38.2% retracement, 100-period SMA) before 1.3330 (static level).
Pound Sterling FAQs
The Pound Sterling (GBP) is the oldest currency in the world (886 AD) and the official currency of the United Kingdom. It is the fourth most traded unit for foreign exchange (FX) in the world, accounting for 12% of all transactions, averaging $630 billion a day, according to 2022 data. Its key trading pairs are GBP/USD, also known as ‘Cable’, which accounts for 11% of FX, GBP/JPY, or the ‘Dragon’ as it is known by traders (3%), and EUR/GBP (2%). The Pound Sterling is issued by the Bank of England (BoE).
The single most important factor influencing the value of the Pound Sterling is monetary policy decided by the Bank of England. The BoE bases its decisions on whether it has achieved its primary goal of “price stability” – a steady inflation rate of around 2%. Its primary tool for achieving this is the adjustment of interest rates. When inflation is too high, the BoE will try to rein it in by raising interest rates, making it more expensive for people and businesses to access credit. This is generally positive for GBP, as higher interest rates make the UK a more attractive place for global investors to park their money. When inflation falls too low it is a sign economic growth is slowing. In this scenario, the BoE will consider lowering interest rates to cheapen credit so businesses will borrow more to invest in growth-generating projects.
Data releases gauge the health of the economy and can impact the value of the Pound Sterling. Indicators such as GDP, Manufacturing and Services PMIs, and employment can all influence the direction of the GBP. A strong economy is good for Sterling. Not only does it attract more foreign investment but it may encourage the BoE to put up interest rates, which will directly strengthen GBP. Otherwise, if economic data is weak, the Pound Sterling is likely to fall.
Another significant data release for the Pound Sterling is the Trade Balance. This indicator measures the difference between what a country earns from its exports and what it spends on imports over a given period. If a country produces highly sought-after exports, its currency will benefit purely from the extra demand created from foreign buyers seeking to purchase these goods. Therefore, a positive net Trade Balance strengthens a currency and vice versa for a negative balance.
Information on these pages contains forward-looking statements that involve risks and uncertainties. Markets and instruments profiled on this page are for informational purposes only and should not in any way come across as a recommendation to buy or sell in these assets. You should do your own thorough research before making any investment decisions. FXStreet does not in any way guarantee that this information is free from mistakes, errors, or material misstatements. It also does not guarantee that this information is of a timely nature. Investing in Open Markets involves a great deal of risk, including the loss of all or a portion of your investment, as well as emotional distress. All risks, losses and costs associated with investing, including total loss of principal, are your responsibility. The views and opinions expressed in this article are those of the authors and do not necessarily reflect the official policy or position of FXStreet nor its advertisers. The author will not be held responsible for information that is found at the end of links posted on this page.
If not otherwise explicitly mentioned in the body of the article, at the time of writing, the author has no position in any stock mentioned in this article and no business relationship with any company mentioned. The author has not received compensation for writing this article, other than from FXStreet.
FXStreet and the author do not provide personalized recommendations. The author makes no representations as to the accuracy, completeness, or suitability of this information. FXStreet and the author will not be liable for any errors, omissions or any losses, injuries or damages arising from this information and its display or use. Errors and omissions excepted.
The author and FXStreet are not registered investment advisors and nothing in this article is intended to be investment advice.