
XAU/USD Current price: $3,324.34
- US President Donald Trump reported progress in Russia-Ukraine peace talks.
- Financial markets await fresh monetary policy clues from worldwide policymakers.
- XAU/USD trades at fresh weekly lows and aims to extend its slide.
Spot Gold came under selling pressure during American trading hours, easing towards the $3,320 area. The bright metal retreated as the US Dollar (USD) gathered momentum amid fresh optimism about a resolution of the Russian Ukraine war. On Monday, United States (US) President Donald Trump met with the Kyiv leader, Volodymyr Zelenskyy, and different European authorities to discuss the conditions for a peace agreement.
After the meeting, Trump reported progress and said he would help Ukraine get secure conditions for a peace deal, but excluded the country from joining the North Atlantic Treaty Organization (NATO). He also stated the next meeting should be between Zelenskyy and Russian President Vladimir Putin.
Later, Trump offered an interview to FOX News, in which he added that he hopes Putin “will be good,” and if he’s not, it will become a “rough situation.”
Other than that, investors kept an eye on Canadian inflation data. Canada’s headline Consumer Price Index (CPI) recorded an annual 1.7% increase in July, down from the 1.9% posted in June and matching estimates, according to Statistics Canada. The Bank of Canada (BoC) core annual CPI printed at 2.6% for the year to July, slightly below the previous 2.7%.
Market players are now waiting for the Federal Open Market Committee (FOMC) meeting Minutes scheduled for Wednesday, and the Jackson Hole Symposium taking place this week. Policymakers’ words are closely watched for potential hints on upcoming monetary policy decisions.
XAU/USD short-term technical outlook
The XAU/USD pair trades near an intraday low of $3,320.98, and technical readings in the daily chart show that a mildly bearish 20 Simple Moving Average (SMA) keeps offering dynamic resistance, currently at around $3,348.00. At the same time, a bullish 100 SMA is losing its bullish strength at around $3,309.00, providing support. Finally, technical indicators diverge, as the Momentum indicator aims north above its midline, while the Relative Strength Index (RSI) indicator gains downward traction at around 45.
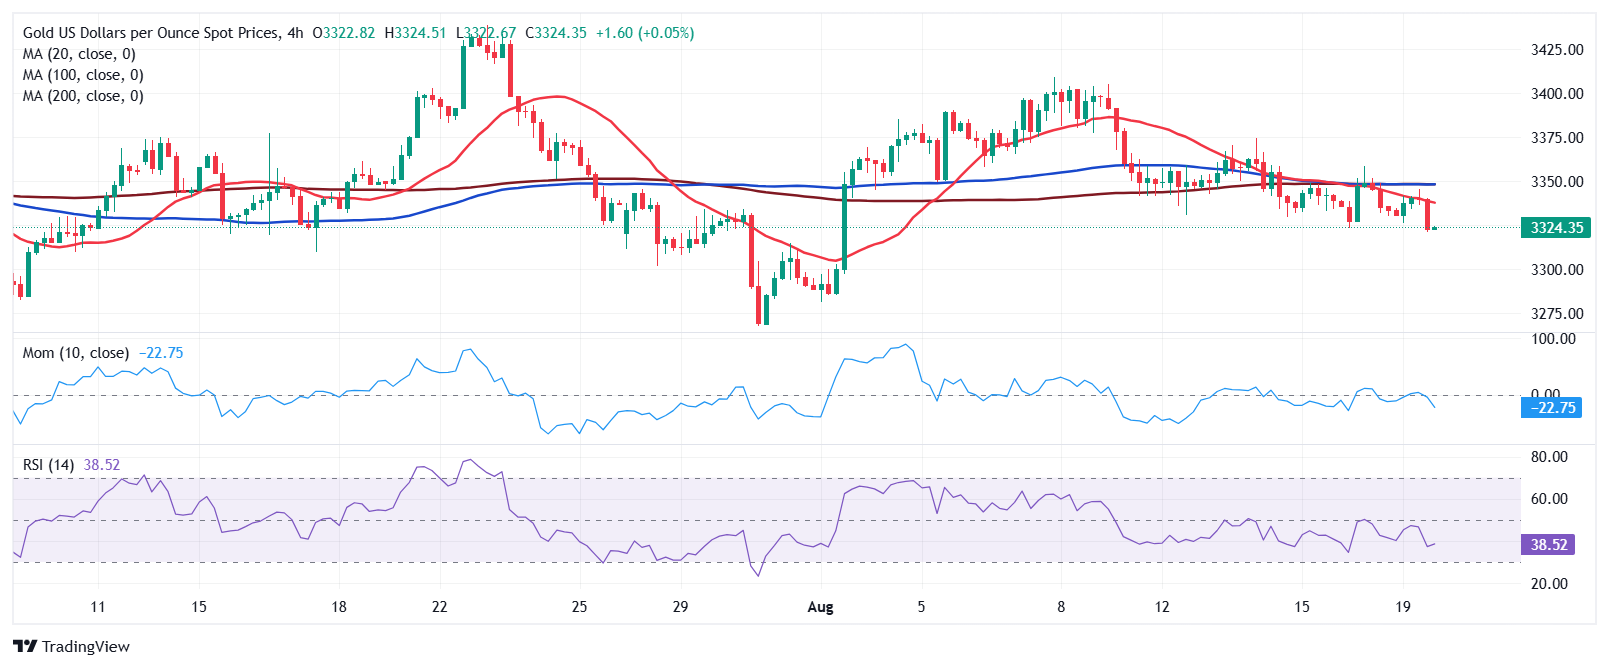
In the near term, and according to the 4-hour chart, the XAU/USD pair is bearish. The 20 SMA accelerated south below converging 100 and 200 SMAs, with the shorter, in line with increased selling interest. At the same time, technical indicators head south within negative levels, in line with lower lows ahead.
Support levels: 3,320.00 3,309.00 3,295.80
Resistance levels: 3,339.20 3,348.00 3,372.30
Information on these pages contains forward-looking statements that involve risks and uncertainties. Markets and instruments profiled on this page are for informational purposes only and should not in any way come across as a recommendation to buy or sell in these assets. You should do your own thorough research before making any investment decisions. FXStreet does not in any way guarantee that this information is free from mistakes, errors, or material misstatements. It also does not guarantee that this information is of a timely nature. Investing in Open Markets involves a great deal of risk, including the loss of all or a portion of your investment, as well as emotional distress. All risks, losses and costs associated with investing, including total loss of principal, are your responsibility. The views and opinions expressed in this article are those of the authors and do not necessarily reflect the official policy or position of FXStreet nor its advertisers. The author will not be held responsible for information that is found at the end of links posted on this page.
If not otherwise explicitly mentioned in the body of the article, at the time of writing, the author has no position in any stock mentioned in this article and no business relationship with any company mentioned. The author has not received compensation for writing this article, other than from FXStreet.
FXStreet and the author do not provide personalized recommendations. The author makes no representations as to the accuracy, completeness, or suitability of this information. FXStreet and the author will not be liable for any errors, omissions or any losses, injuries or damages arising from this information and its display or use. Errors and omissions excepted.
The author and FXStreet are not registered investment advisors and nothing in this article is intended to be investment advice.