
- AUD/USD drifts lower as the RBA’s dovish outlook lifts bets for more interest rate cuts.
- The USD consolidates ahead of the US inflation data and does little to support the pair.
- Rising Fed rate cut bets act as a headwind for the buck amid the upbeat market mood.
The AUD/USD pair attracts fresh sellers near the 0.6525 region and turns lower for the third straight day on Tuesday in reaction to the Reserve Bank of Australia’s (RBA) dovish outlook. As was widely expected, the central bank lowered its cash rate for the third time in 2025, by 25 basis points (bps) to a two-year low of 3.6%, the lowest since April 2023. In the accompanying policy statement, the RBA said that cooling inflation will likely spur more rate cuts and slashed its outlook for economic growth in 2025 to 1.7% from 2.1%. The RBA also marginally lowered GDP forecasts for 2026 and 2027, to 2% and 2.1%, respectively, though it maintained the annual consumer price index and unemployment rate forecasts at 3% and 4.3%, respectively.
Furthermore, RBA Governor Michele Bullock said during the post-meeting press conference that the updated forecasts imply cash rates might need to be lower for price stability. Adding to this, Bullock did not rule out back-to-back rate cuts and noted that the forward-looking policy assumes we can continue to lower rates. This offsets the latest optimism over an extension of the US-China trade truce for another three months and exerts some downward pressure on the Australian Dollar (AUD). The US Dollar (USD), on the other hand, struggles to capitalize on its gains registered over the past two days amid rising bets that the Federal Reserve (Fed) will resume its rate-cutting cycle in September, which, in turn, offers support to the AUD/USD pair.
Meanwhile, a series of disappointing US economic data released recently, including the Nonfarm Payrolls (NFP) report, which signaled that the economy could be weakening, lifted expectations that the Fed could deliver at least two rate cuts by the year-end. This, along with the underlying bullish sentiment, undermines the Greenback’s safe-haven status and limits the downside for the risk-sensitive Aussie. Traders also seem reluctant and opt to wait for the release of the US consumer inflation figures for more cues about the Fed’s rate-cut path. This, in turn, will influence the USD price dynamics and provide some impetus to the AUD/USD pair ahead of the Australian Wage Price Index on Wednesday and monthly employment details on Thursday.
Furthermore, the US Producer Price Index (PPI) on Thursday, Chinese data dump, and the Michigan US Consumer Sentiment Index on Friday should infuse volatility around the AUD/USD pair during the latter part of the week. Hence, it will be prudent to wait for strong follow-through selling before positioning for an extension of the recent pullback from the monthly peak, around the 0.6640 region touched last Thursday.
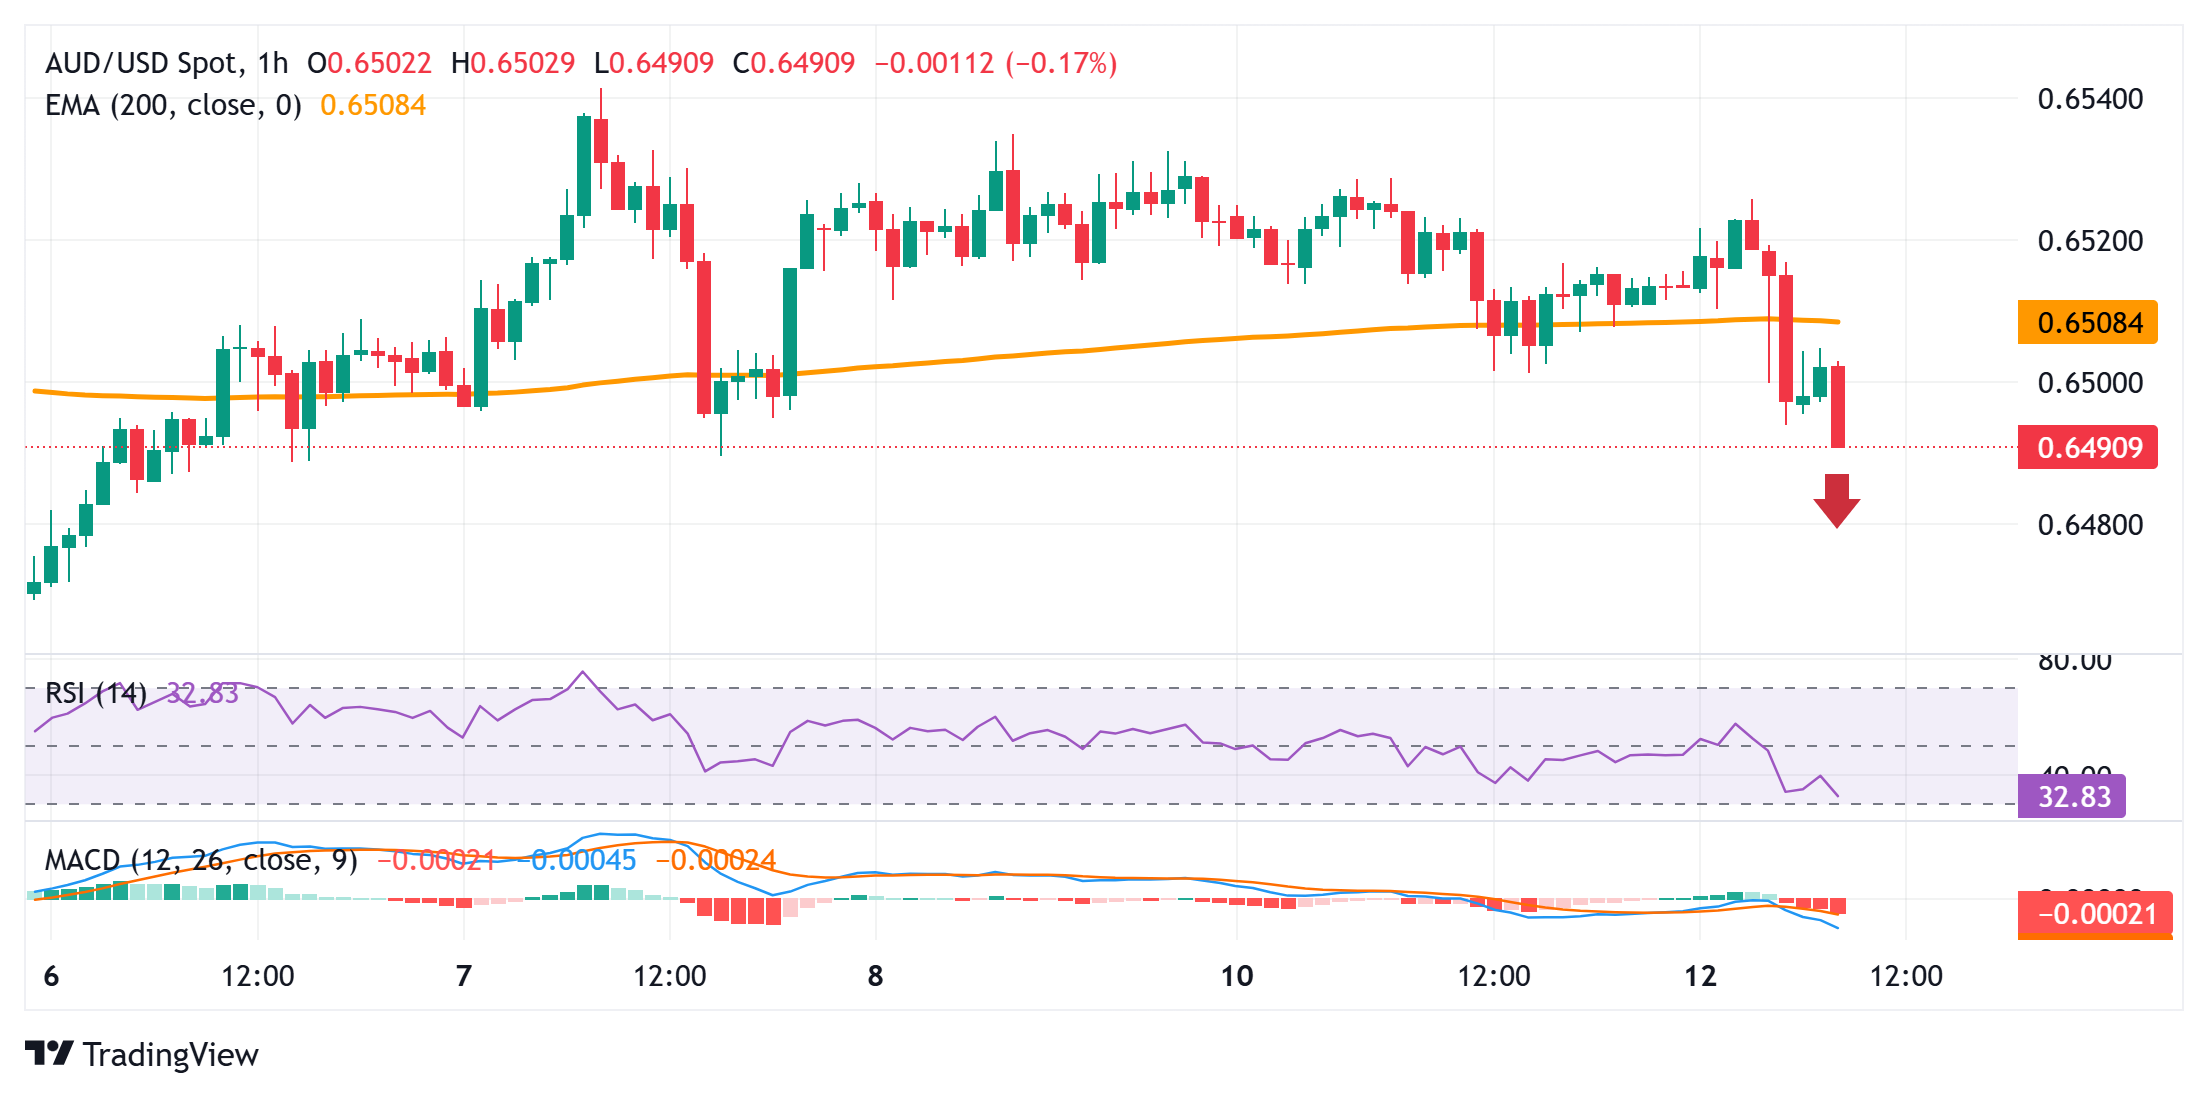
AUD/USD 1-hour chart
Technical Outlook
The intraday slide drags the AUD/USD pair below the 200-hour Exponential Moving Average (EMA) pivotal support, around the 0.6500 psychological mark. Moreover, negative oscillators on hourly/daily charts back the case for deeper losses. Hence, some follow-through weakness below the 200-day Simple Moving Average (SMA), currently pegged near the 0.6455 region, looks like a distinct possibility. The downward trajectory could extend further towards the monthly swing low, around the 0.6420-0.6415 region, en route to the 0.6400 round figure. Acceptance below the latter will be seen as a fresh trigger for bearish traders and pave the way for a further depreciating move.
On the flip side, the daily swing high, around the 0.6525 region, could act as an immediate resistance. Some follow-through buying beyond the 0.6540 area, or the monthly top touched last Thursday, might negate any near-term negative bias and lift the AUD/USD pair to the 0.6680 region, or November 2024 swing high, en route to the 0.6700 round figure.
Information on these pages contains forward-looking statements that involve risks and uncertainties. Markets and instruments profiled on this page are for informational purposes only and should not in any way come across as a recommendation to buy or sell in these assets. You should do your own thorough research before making any investment decisions. FXStreet does not in any way guarantee that this information is free from mistakes, errors, or material misstatements. It also does not guarantee that this information is of a timely nature. Investing in Open Markets involves a great deal of risk, including the loss of all or a portion of your investment, as well as emotional distress. All risks, losses and costs associated with investing, including total loss of principal, are your responsibility. The views and opinions expressed in this article are those of the authors and do not necessarily reflect the official policy or position of FXStreet nor its advertisers. The author will not be held responsible for information that is found at the end of links posted on this page.
If not otherwise explicitly mentioned in the body of the article, at the time of writing, the author has no position in any stock mentioned in this article and no business relationship with any company mentioned. The author has not received compensation for writing this article, other than from FXStreet.
FXStreet and the author do not provide personalized recommendations. The author makes no representations as to the accuracy, completeness, or suitability of this information. FXStreet and the author will not be liable for any errors, omissions or any losses, injuries or damages arising from this information and its display or use. Errors and omissions excepted.
The author and FXStreet are not registered investment advisors and nothing in this article is intended to be investment advice.