
EUR/USD Current price: 1.1717
- US President Donald Trump’s back and forth with tariffs weigh on the market’s mood.
- The US NFIB Fussiness Optimism Index eased to 98.6 in June from the previous 98.8.
- EUR/USD at risk of falling towards 1.1630 according to near-term technical readings.
The EUR/USD pair retains a soft tone on Tuesday, trading a handful of pips above the 1.1700 mark, yet with limited bullish potential. The US Dollar (USD) eased throughout the first half of the day, following news that United States (US) President Donald Trump delayed, once again, the implementation of reciprocal tariffs.
After sending letters to multiple countries announcing fresh levies ranging between 25% and 40%, Trump extended the grace period until August 1, from the previous July 9. Even further, he signaled there could be more delays in order to negotiate trade deals. Wall Street closed in the red, and the USD came under selling pressure with the news, although no major level gave up.
The mood started souring during European trading hours, with local indexes feeling the heat and weighing on US futures. The USD recovered and aims higher in the near term, early in the American session.
Data-wise, there’s not much to take care of. There were no relevant news in Europe, while the US published the NFIB Fussiness Optimism Index for June, which eased to 98.6 from the previous 98.8. The country will later release the May Consumer Credit Change and weekly API oil data.
EUR/USD short-term technical outlook
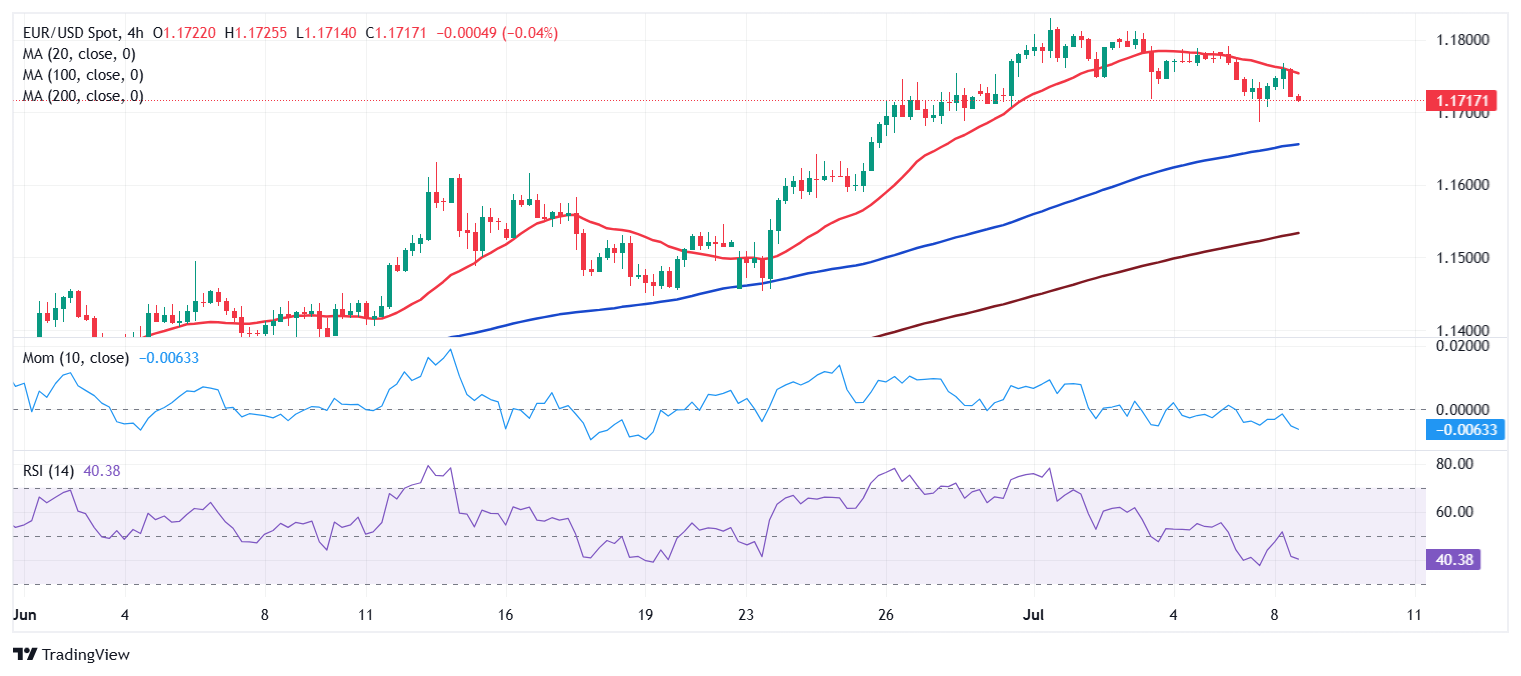
The EUR/USD pair is holding on to modest intraday gains, yet down from its peak at 1.1767. From a technical perspective, the daily chart shows the bullish case remains firm in place. EUR/USD develops far above bullish moving averages, with the 20 Simple Moving Average (SMA) currently at around 1.1630. Technical indicators, in the meantime, grind marginally higher well into positive levels and after correcting overbought conditions.
The 4-hour chart shows that the EUR/USD pair keeps finding sellers at around a bearish 20 SMA, while developing far above bullish 100 and 200 SMAs. At the same time, technical indicators resumed their slides after failing to overcome their midlines. Another leg lower seems likely, as long as sellers keep rejecting advances at around 1.1770.
Support levels: 1.1685 1.1635 1.1590
Resistance levels: 1.1770 1.1800 1.1830
Information on these pages contains forward-looking statements that involve risks and uncertainties. Markets and instruments profiled on this page are for informational purposes only and should not in any way come across as a recommendation to buy or sell in these assets. You should do your own thorough research before making any investment decisions. FXStreet does not in any way guarantee that this information is free from mistakes, errors, or material misstatements. It also does not guarantee that this information is of a timely nature. Investing in Open Markets involves a great deal of risk, including the loss of all or a portion of your investment, as well as emotional distress. All risks, losses and costs associated with investing, including total loss of principal, are your responsibility. The views and opinions expressed in this article are those of the authors and do not necessarily reflect the official policy or position of FXStreet nor its advertisers. The author will not be held responsible for information that is found at the end of links posted on this page.
If not otherwise explicitly mentioned in the body of the article, at the time of writing, the author has no position in any stock mentioned in this article and no business relationship with any company mentioned. The author has not received compensation for writing this article, other than from FXStreet.
FXStreet and the author do not provide personalized recommendations. The author makes no representations as to the accuracy, completeness, or suitability of this information. FXStreet and the author will not be liable for any errors, omissions or any losses, injuries or damages arising from this information and its display or use. Errors and omissions excepted.
The author and FXStreet are not registered investment advisors and nothing in this article is intended to be investment advice.