

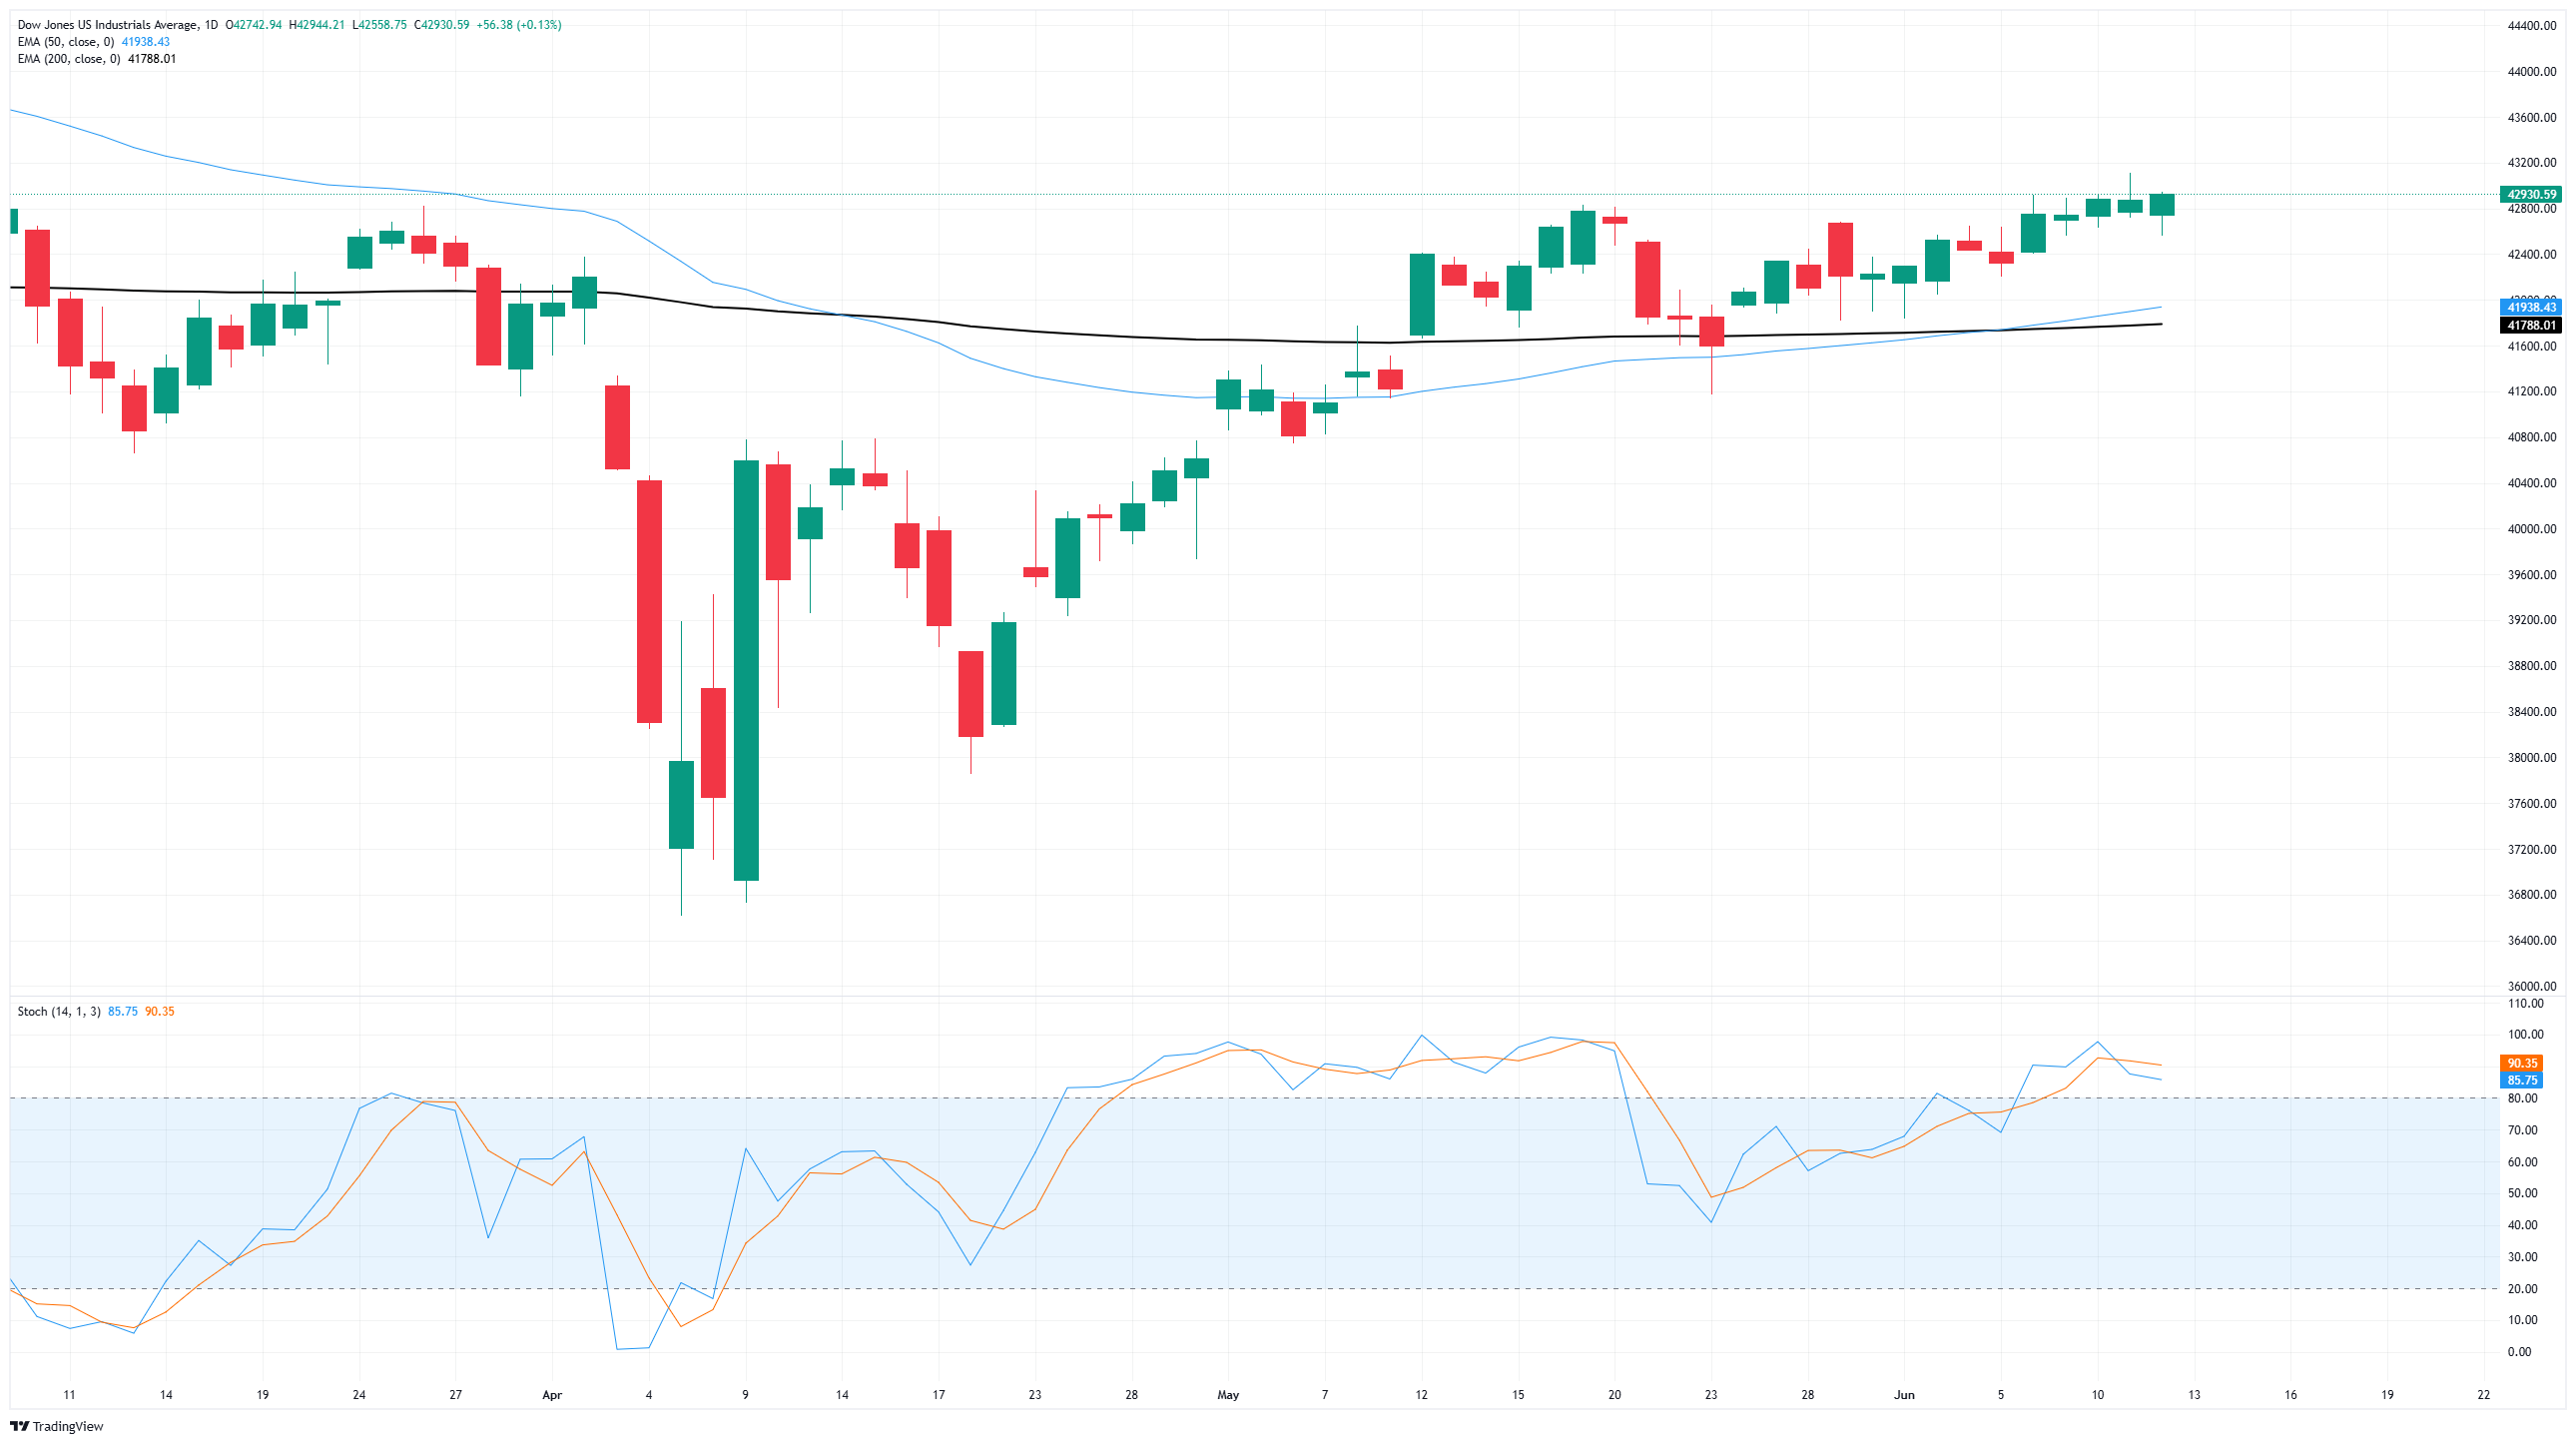
- The Dow Jones pushed back up into the 43,000 region after upbeat PPI inflation print.
- Market expectations of Fed rate cuts later this year have roared back to life.
- Despite low inflation data this week, potential price impacts from tariffs still loom ahead.
The Dow Jones Industrial Average (DJIA) caught a bullish bid on Thursday, bolstered by better-than-expected Producer Price Index (PPI) inflation data for May. Pricing pressures remain tepid despite the Trump administration’s best efforts to make the US economy pay excess international trade taxes, and the lack of immediate price volatility impacts are re-igniting market expectations of a Federal Reserve (Fed) rate cut in September.
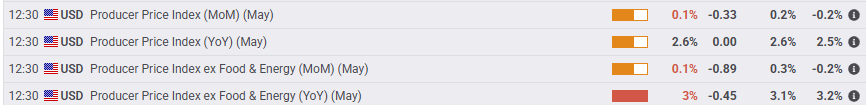
PPI inflation rebounded in May, and previous data saw a slight upward revision, but the overall figures still came in below median market forecasts. Annualized core PPI inflation eased to 3.0% YoY, while headline PPI inflation rose to 2.6% YoY.
This week’s overall tepid inflation data for both consumers and producers has galvanized market bets for the start of the Fed’s next rate-cutting cycle. According to the CME’s FedWatch Tool, rate traders are pricing in nearly 80% odds of at least a 25 basis point rate trim when the Fed gathers for its September rate call. In the meantime, the Fed is expected to continue holding rates flat for the next two rate meetings.
The University of Michigan’s (UoM) Consumer Sentiment Index for June will land on markets on Friday to wrap up the trading week, and median market forecasts expect an overall rebound in aggregated consumer sentiment survey results. Investors will also keep a close eye on the UoM’s 1-year and 5-year Consumer Inflation Expectations, which are holding uncomfortably high at 6.6% and 4.2%, respectively.
Dow Jones price forecast
Thursday’s bullish push is keeping the Dow Jones Industrial Average within touch range of the 43,000 major price handle, but meaningful momentum remains limited. Price action continues to get mired in a recent congestion zone, and the major equity index is struggling to put distance between bids and the 200-day Exponential Moving Average (EMA) near 41,780.
Dow Jones daily chart
Economic Indicator
Producer Price Index (YoY)
The Producer Price Index released by the Bureau of Labor statistics, Department of Labor measures the average changes in prices in primary markets of the US by producers of commodities in all states of processing. Changes in the PPI are widely followed as an indicator of commodity inflation. Generally speaking, a high reading is seen as positive (or bullish) for the USD, whereas a low reading is seen as negative (or bearish).
Information on these pages contains forward-looking statements that involve risks and uncertainties. Markets and instruments profiled on this page are for informational purposes only and should not in any way come across as a recommendation to buy or sell in these assets. You should do your own thorough research before making any investment decisions. FXStreet does not in any way guarantee that this information is free from mistakes, errors, or material misstatements. It also does not guarantee that this information is of a timely nature. Investing in Open Markets involves a great deal of risk, including the loss of all or a portion of your investment, as well as emotional distress. All risks, losses and costs associated with investing, including total loss of principal, are your responsibility. The views and opinions expressed in this article are those of the authors and do not necessarily reflect the official policy or position of FXStreet nor its advertisers. The author will not be held responsible for information that is found at the end of links posted on this page.
If not otherwise explicitly mentioned in the body of the article, at the time of writing, the author has no position in any stock mentioned in this article and no business relationship with any company mentioned. The author has not received compensation for writing this article, other than from FXStreet.
FXStreet and the author do not provide personalized recommendations. The author makes no representations as to the accuracy, completeness, or suitability of this information. FXStreet and the author will not be liable for any errors, omissions or any losses, injuries or damages arising from this information and its display or use. Errors and omissions excepted.
The author and FXStreet are not registered investment advisors and nothing in this article is intended to be investment advice.


