Bullish view
- Buy the BTC/USD pair and set a take-profit at 112,000.
- Add a stop-loss at 104,000.
- Timeline: 1-2 days.
Bearish view
- Sell the BTC/USD pair and set a take-profit at 104,000.
- Add a stop-loss at 112,000.
Bitcoin price held steady above $107,000 as demand among retail and institutional investors rose. The BTC/USD pair has jumped by almost 10% from its lowest point this week. It has also soared by 45% from its lowest level in April.
Bitcoin jumped as market participants reacted to the recently announced ceasefire between Iran and Israel. In a statement on Wednesday, Donald Trump confirmed that the US will hold negotiations with Iran next week.
He, however, cast doubt on the need for more talks now that the US has damaged its key nuclear sites. He also reiterated that the US had obliterated the three nuclear sites in Iran as reports by CNN and the New York Times said that the damage was limited.
The ceasefire and potential OPEC+ supply increases have led to lower crude oil prices, with Brent and West Texas Intermediate (WTI) falling from over $80 on Monday to below $70.
Lower oil and shipping prices will help to keep inflation in check, which will be a good thing for risky assets like Bitcoin and the stock market. Lower inflation will push the Federal Reserve to cut interest rates in the next few months.
The BTC/USD pair also jumped as demand from Wall Street investors rose. Data shows that inflows into spot Bitcoin ETFs continued in the past 15 consecutive days, bringing the total increase to nearly $50 billion.
The rising ETF demand happened as data shows that the supply of Bitcoin in exchanges dropped to the lowest level in years. The supply and demand dynamics may push Bitcoin higher in the long term.
Looking ahead, the next key catalyst for Bitcoin will be Friday’s personal consumption expenditure (PCE) data. The inflation report will provide more information on the country’s inflation.
BTC/USD Technical Analysis
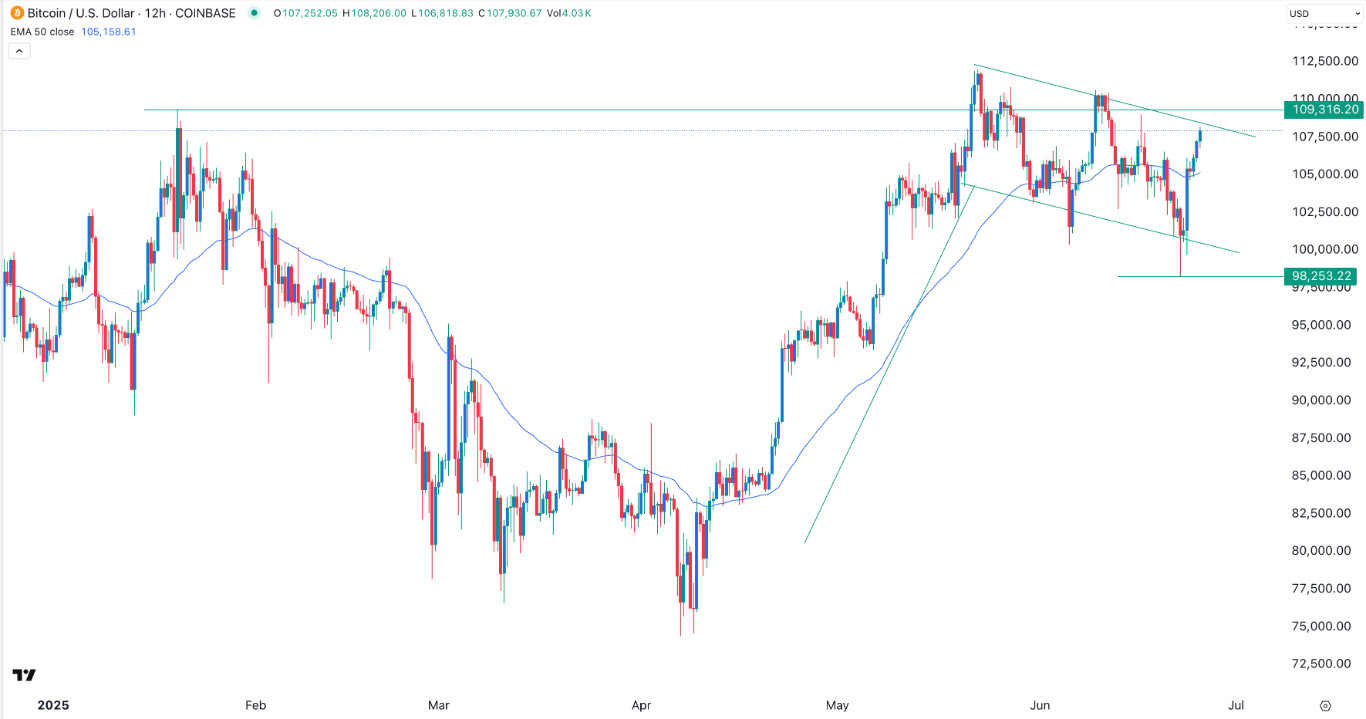
The 12-hour chart shows that the BTC/USD pair dropped and bottomed at 98,250 on Monday as geopolitical concerns rose. It then bounced back to a high of over 107,000.
Bitcoin has moved above the 50-period Exponential Moving Average (EMA). It has also formed a bullish flag pattern, which comprises of a vertical line and a descending channel. It has moved slightly below the lower side of the descending channel.
Therefore, the BTC/USD pair will likely have a bullish breakout, potentially to the all-time high of 111,900. A move above that level will point to more gains, potentially to 115,000.
Ready to trade our free daily Forex trading signals? We’ve shortlisted the best MT4 crypto brokers in the industry for you.
Crispus Nyaga is a financial analyst, coach, and trader with more than 8 years in the industry. He has worked for leading companies like ATFX, easyMarkets, and OctaFx. Further, he has published widely in platforms like SeekingAlpha, Investing Cube, Capital.com, and Invezz. In his free time, he likes watching golf and spending time with his wife and child.


