
- WTI Oil surges above $72 as Israel-Iran tensions trigger a breakout.
- Gains for June are near 20%, pushing prices above key Fibonacci levels from longer-term moves.
- The 12-month moving average provides additional support below $70.
WTI crude oil is surging amid escalating geopolitical tensions, with Israel’s recent strikes on Iran fueling a rally that pushed prices above the $74.00 handle on Friday. At the time of writing, WTI is trading just below $72.00 after Iran responded with its own missile barrage, marking a near 20% gain for June and reversing much of the weakness observed earlier this year.
Despite broad-based pressure in the first half of 2025, the recent price surge has lifted WTI back above several key technical levels, with bullish momentum building across multiple timeframes.
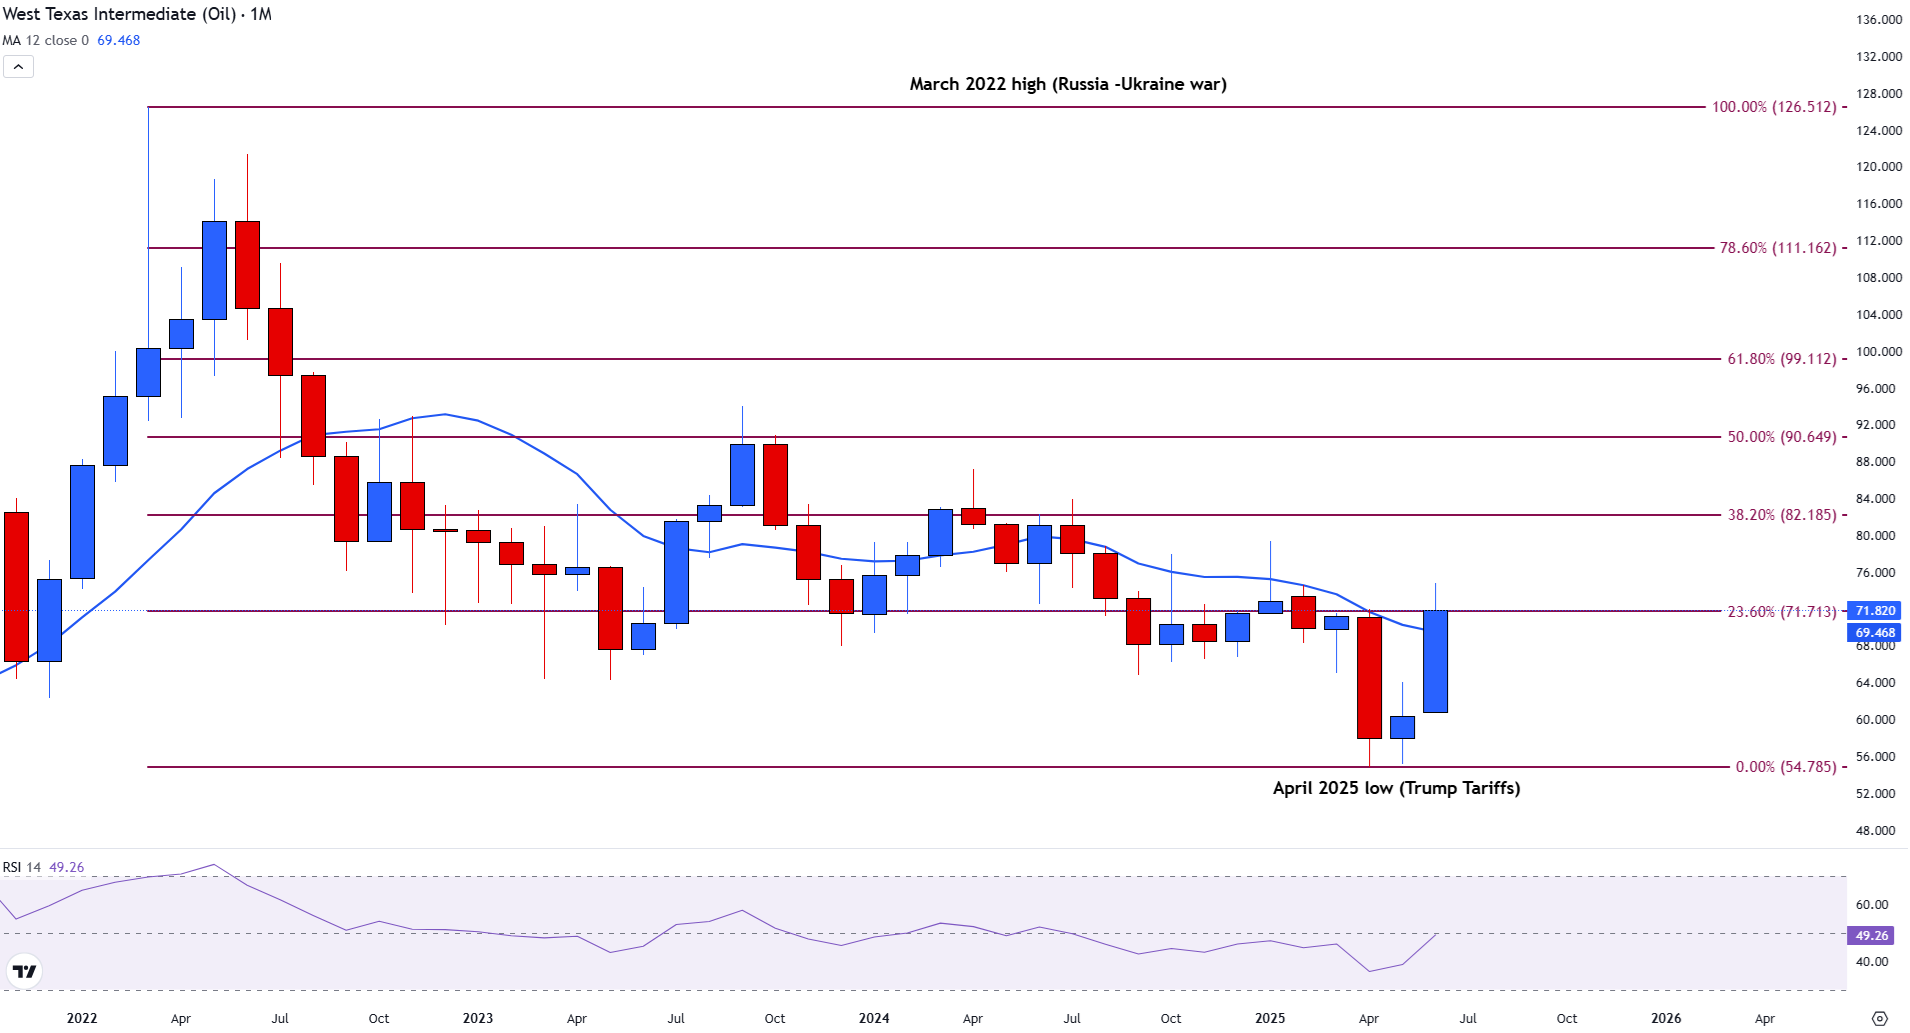
WTI Oil long-term setup
From a longer-term perspective, WTI has reclaimed the 12-month Simple Moving Average (SMA), currently sitting at $69.46. This level now serves as dynamic support. Above, resistance is forming at the 23.6% Fibonacci retracement of the March 2022 high to the April 2025 low, located at $71.71.
WTI Oil Monthly Chart
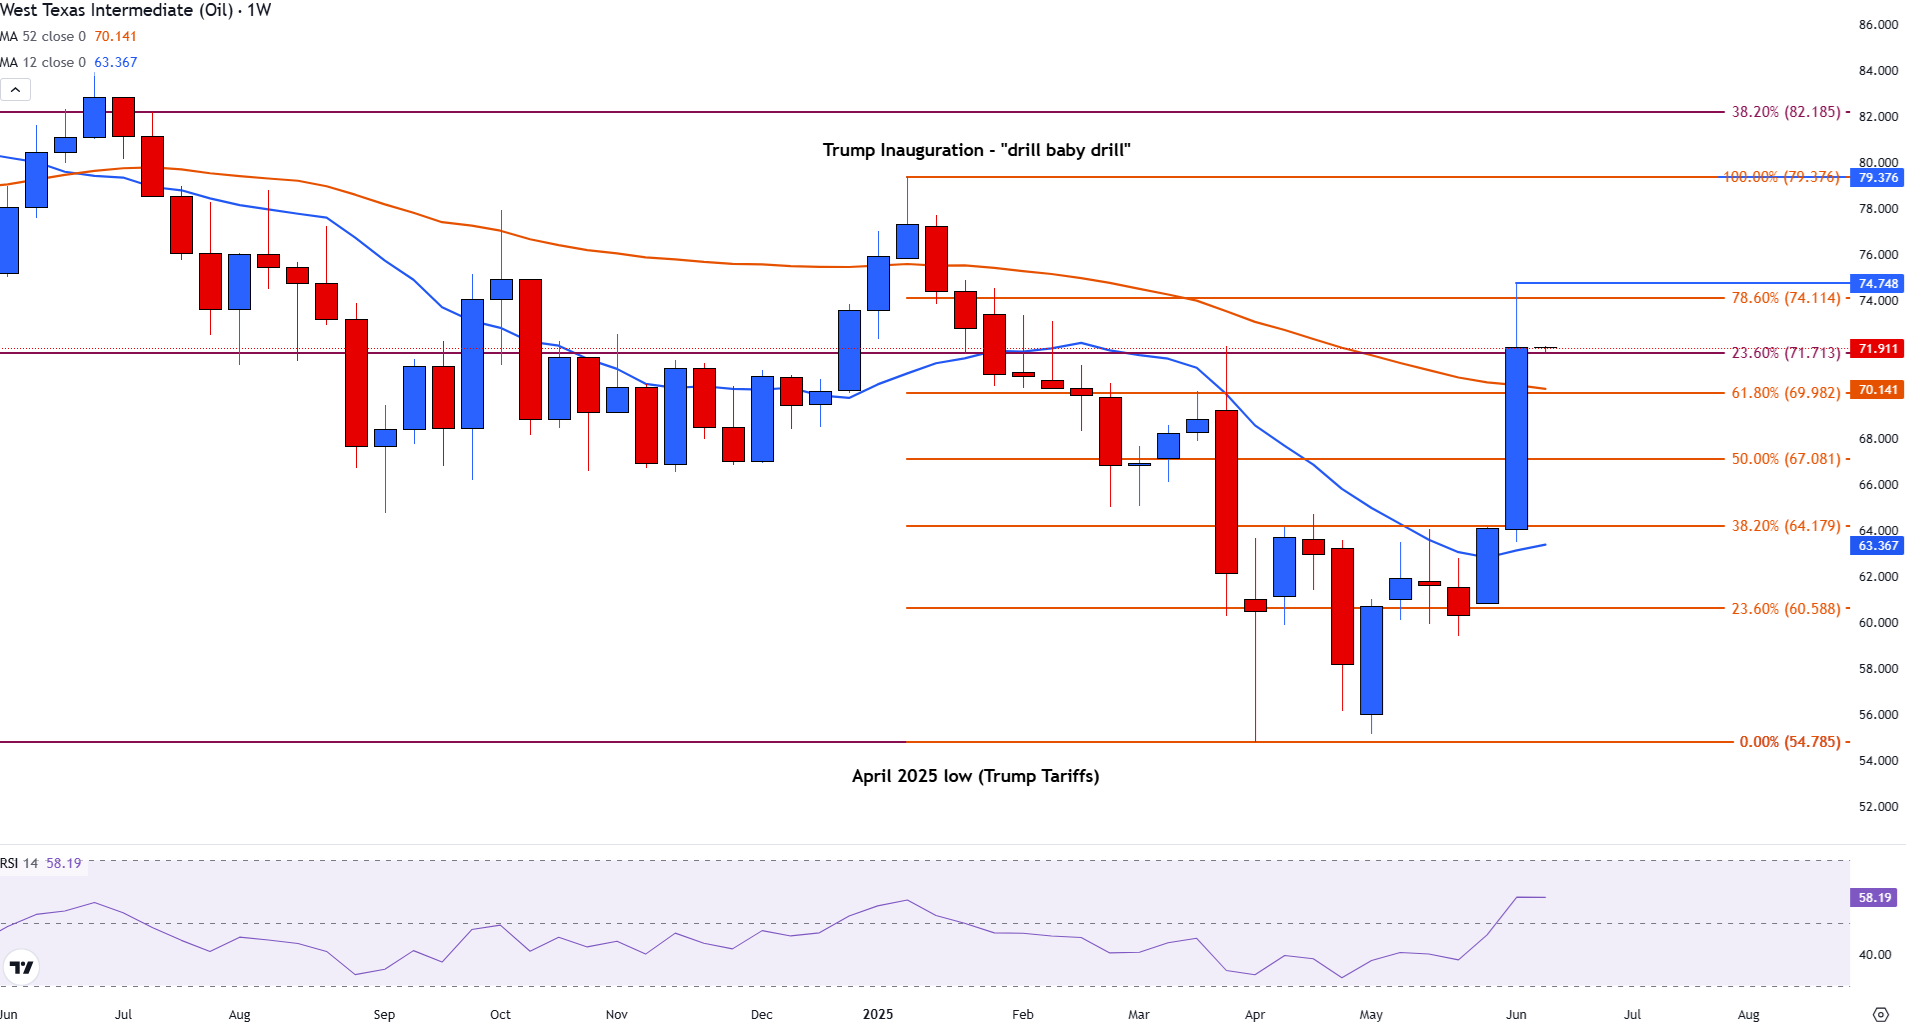
WTI Oil medium-term setup
On the weekly chart, WTI broke above the 12-week SMA at $63.29 following the Iran-Israel escalation, marking a pivotal shift in sentiment. This surge has brought prices up to the 78.6% Fibonacci retracement of the January–April decline at $74.11. The 12-week SMA continues to offer support near $63.31, underlining a strong base for bulls.
WTI Oil Weekly Chart
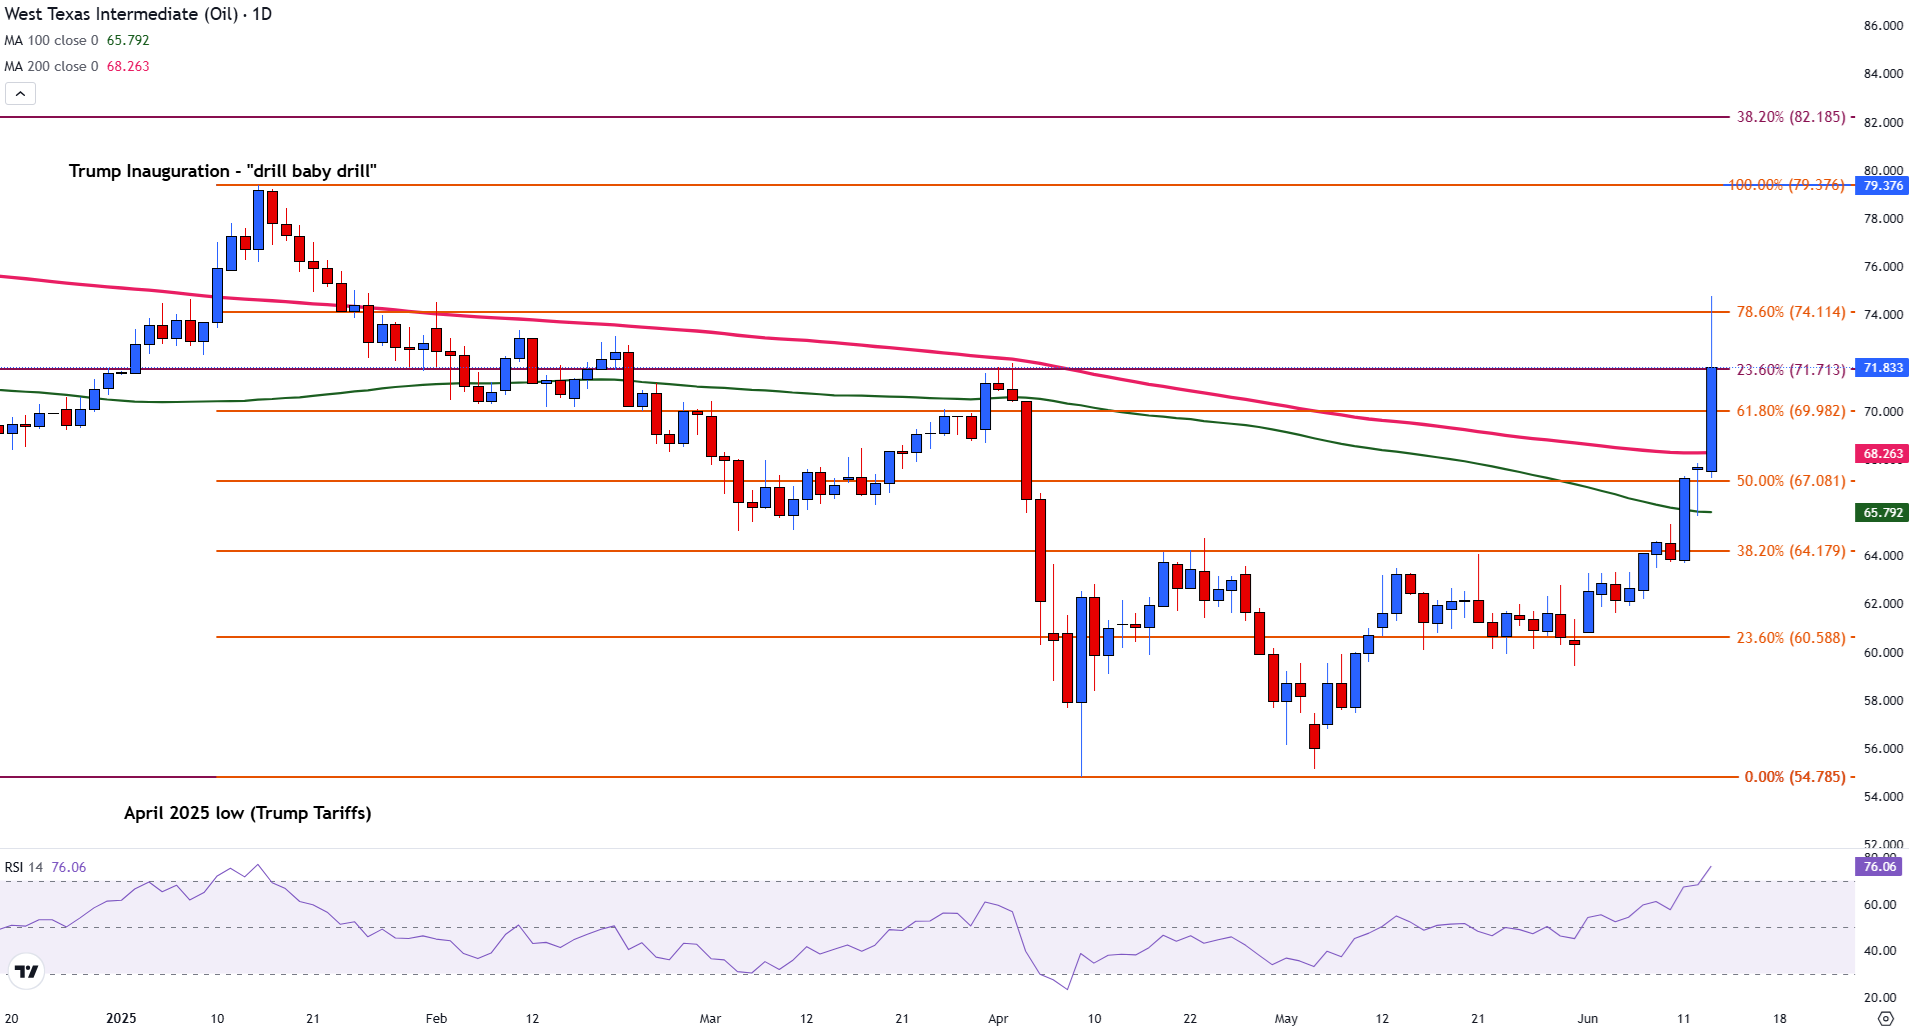
WTI Oil short-term setup
Zooming into the daily chart, Friday’s bullish momentum drove a decisive move above both the 100-day and 200-day SMAs, strengthening the case for further upside. Technical confluence with long-term Fibonacci levels adds credibility to the breakout.
The Relative Strength Index (RSI) on the daily timeframe currently sits at 76, signaling overbought conditions. However, with the geopolitical backdrop intensifying, fundamental support may ultimately prevail over short-term exhaustion.
WTI Oil Daily Chart
Looking ahead: What’s next for Oil?
If WTI breaks and holds above $74.11 early next week, momentum could carry it toward $76.00 and eventually $78.00. Conversely, failure to maintain levels above $71.71 may trigger a retracement, especially if geopolitical tensions ease or if market focus returns to demand-side concerns.
Information on these pages contains forward-looking statements that involve risks and uncertainties. Markets and instruments profiled on this page are for informational purposes only and should not in any way come across as a recommendation to buy or sell in these assets. You should do your own thorough research before making any investment decisions. FXStreet does not in any way guarantee that this information is free from mistakes, errors, or material misstatements. It also does not guarantee that this information is of a timely nature. Investing in Open Markets involves a great deal of risk, including the loss of all or a portion of your investment, as well as emotional distress. All risks, losses and costs associated with investing, including total loss of principal, are your responsibility. The views and opinions expressed in this article are those of the authors and do not necessarily reflect the official policy or position of FXStreet nor its advertisers. The author will not be held responsible for information that is found at the end of links posted on this page.
If not otherwise explicitly mentioned in the body of the article, at the time of writing, the author has no position in any stock mentioned in this article and no business relationship with any company mentioned. The author has not received compensation for writing this article, other than from FXStreet.
FXStreet and the author do not provide personalized recommendations. The author makes no representations as to the accuracy, completeness, or suitability of this information. FXStreet and the author will not be liable for any errors, omissions or any losses, injuries or damages arising from this information and its display or use. Errors and omissions excepted.
The author and FXStreet are not registered investment advisors and nothing in this article is intended to be investment advice.