
- The Australian Dollar declines due to dampened risk sentiment amid rising tensions in the Middle East.
- Israeli military officials said that Israel attacked dozens of nuclear sites across Iran.
- The US Producer Price Index rose 0.1% MoM in May, against the expectation of a 0.2% rise.
The Australian Dollar (AUD) declines against the US Dollar (USD) on Friday, with over 1% losses. The AUD/USD pair depreciates due to escalating tensions in the Middle East.
Israeli Minister of Defense Israel Katz warned his country to face a missile and drone attack following Israel’s preemptive attack on Iran. Katz declared a special state of emergency in the country, per Axios. Israeli military officials said that Israel attacked dozens of sites across Iran, as the Iranian nuclear program is an existential threat to Israel.
Reuters reported that US President Donald Trump expanded steel tariffs starting June 23 on imported “steel derivative products,” including household appliances, such as dishwashers, washing machines, refrigerators, etc. The tariffs were initially imposed at 25% in March and later doubled to 50% for most countries. This is the second time the scope of affected products has been expanded.
Australian Dollar depreciates as US Dollar advances due to improved safe-haven demand
- The US Dollar Index (DXY), which measures the value of the US Dollar against six major currencies, is recovering losses and trading higher at around 98.10 at the time of writing. The US Michigan Consumer Sentiment will be eyed later on Friday.
- The US Producer Price Index (PPI) climbed 0.1% month-over-month in May, compared to a decline of 0.2% (revised from -0.5%). This reading came in softer than the expected 0.2% rise. Meanwhile, the core PPI, excluding food and energy, increased 0.1% MoM in May versus -0.2% prior (revised from -0.4%), below the consensus of 0.3%.
- President Trump posted on Truth Social on Wednesday that the trade deal with China is done and added that it is subject to his and Chinese President Xi Jinping’s final approval. “We are getting a total of 55% tariffs, China is getting 10%. Relationship is excellent! Thank you for your attention to this matter.”
- China will grant only six-month rare-earth export licenses for US automakers and manufacturers, which suggests that China wants to have control over critical minerals as leverage in future talks, per the Wall Street Journal (gated).
- The US Consumer Price Index (CPI) rose 2.4% YoY in May, slightly above 2.3% prior but below the market expectations of a 2.5% increase. The core CPI, which excludes volatile food and energy prices, climbed 2.8% YoY in May, compared to the consensus of 2.9%.
- On Wednesday, President Trump stated that he would like to extend the trade talks deadline, but doesn’t think it will be necessary. Trump further stated that he will set unilateral tariff rates within two weeks.
- The US Court of Appeals for the Federal Circuit extended an earlier, temporary respite on Tuesday for the government as it presses a challenge to a lower court ruling last month that blocked the tariffs. The federal appeals court has ruled that President Trump’s broad tariffs can remain in effect while legal appeals continue, per Bloomberg.
- China’s Trade Balance (CNY) arrived at CNY743.56 billion in May, expanding from the previous surplus of CNY689.99 billion. Meanwhile, Exports rose 6.3% YoY against 9.3% in April. The country’s imports fell 2.1% YoY in the same period, from a 0.8% rise recorded previously.
- Australia’s Trade Balance posted a 5,413M surplus month-over-month in April, below the 6,100M expected and 6,892M (revised from 6,900M) in the previous reading. Exports declined by 2.4% MoM in April, against a 7.2% rise prior (revised from 7.6%). Meanwhile, Imports rose by 1.1%, compared to a decline of 2.4% (revised from -2.2%) seen in March. China’s Caixin Services PMI rose to 51.1 in May as expected, from 50.7 in April.
Australian Dollar falls toward 0.6450 near 50-day EMA
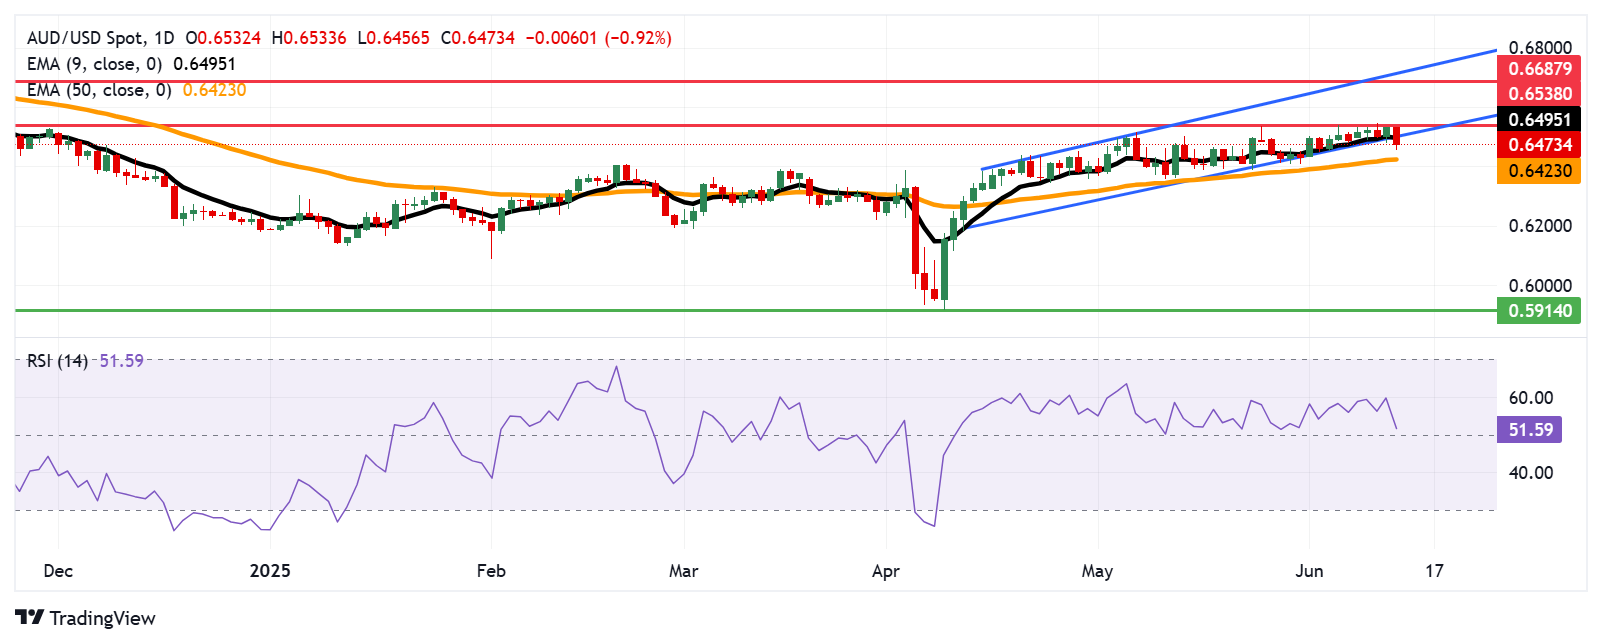
AUD/USD pair trading around 0.6460 on Friday. The daily chart’s technical analysis indicates a weakening of the bullish bias as the pair has breached below the lower boundary of the ascending channel. Additionally, the pair moving below the nine-day Exponential Moving Average (EMA) suggests that short-term price momentum is weakening. However, the 14-day Relative Strength Index (RSI) is still positioned slightly above the 50 mark, indicating a bullish bias is in play.
On the downside, the AUD/USD pair may further test the 50-day EMA at 0.6423. A break below this level may weaken the medium-term price momentum and put downward pressure on the pair to navigate the region around 0.5914, the lowest since March 2020.
The immediate barrier appears at the nine-day EMA of 0.6495, followed by the seven-month high of 0.6538, which was reached on June 5. Further advances could prompt the pair to explore the region around the eight-month high at 0.6687, followed by the upper boundary of the ascending channel around 0.6730.
AUD/USD: Daily Chart
Australian Dollar PRICE Today
The table below shows the percentage change of Australian Dollar (AUD) against listed major currencies today. Australian Dollar was the weakest against the Swiss Franc.
| USD | EUR | GBP | JPY | CAD | AUD | NZD | CHF | |
|---|---|---|---|---|---|---|---|---|
| USD | 0.45% | 0.45% | 0.17% | 0.22% | 0.76% | 0.77% | -0.15% | |
| EUR | -0.45% | 0.04% | -0.23% | -0.16% | 0.40% | 0.29% | -0.59% | |
| GBP | -0.45% | -0.04% | -0.33% | -0.28% | 0.27% | 0.23% | -0.62% | |
| JPY | -0.17% | 0.23% | 0.33% | 0.09% | 0.61% | 0.59% | -0.30% | |
| CAD | -0.22% | 0.16% | 0.28% | -0.09% | 0.52% | 0.55% | -0.34% | |
| AUD | -0.76% | -0.40% | -0.27% | -0.61% | -0.52% | -0.02% | -0.89% | |
| NZD | -0.77% | -0.29% | -0.23% | -0.59% | -0.55% | 0.02% | -0.86% | |
| CHF | 0.15% | 0.59% | 0.62% | 0.30% | 0.34% | 0.89% | 0.86% |
The heat map shows percentage changes of major currencies against each other. The base currency is picked from the left column, while the quote currency is picked from the top row. For example, if you pick the Australian Dollar from the left column and move along the horizontal line to the US Dollar, the percentage change displayed in the box will represent AUD (base)/USD (quote).
Tariffs FAQs
Tariffs are customs duties levied on certain merchandise imports or a category of products. Tariffs are designed to help local producers and manufacturers be more competitive in the market by providing a price advantage over similar goods that can be imported. Tariffs are widely used as tools of protectionism, along with trade barriers and import quotas.
Although tariffs and taxes both generate government revenue to fund public goods and services, they have several distinctions. Tariffs are prepaid at the port of entry, while taxes are paid at the time of purchase. Taxes are imposed on individual taxpayers and businesses, while tariffs are paid by importers.
There are two schools of thought among economists regarding the usage of tariffs. While some argue that tariffs are necessary to protect domestic industries and address trade imbalances, others see them as a harmful tool that could potentially drive prices higher over the long term and lead to a damaging trade war by encouraging tit-for-tat tariffs.
During the run-up to the presidential election in November 2024, Donald Trump made it clear that he intends to use tariffs to support the US economy and American producers. In 2024, Mexico, China and Canada accounted for 42% of total US imports. In this period, Mexico stood out as the top exporter with $466.6 billion, according to the US Census Bureau. Hence, Trump wants to focus on these three nations when imposing tariffs. He also plans to use the revenue generated through tariffs to lower personal income taxes.
Information on these pages contains forward-looking statements that involve risks and uncertainties. Markets and instruments profiled on this page are for informational purposes only and should not in any way come across as a recommendation to buy or sell in these assets. You should do your own thorough research before making any investment decisions. FXStreet does not in any way guarantee that this information is free from mistakes, errors, or material misstatements. It also does not guarantee that this information is of a timely nature. Investing in Open Markets involves a great deal of risk, including the loss of all or a portion of your investment, as well as emotional distress. All risks, losses and costs associated with investing, including total loss of principal, are your responsibility. The views and opinions expressed in this article are those of the authors and do not necessarily reflect the official policy or position of FXStreet nor its advertisers. The author will not be held responsible for information that is found at the end of links posted on this page.
If not otherwise explicitly mentioned in the body of the article, at the time of writing, the author has no position in any stock mentioned in this article and no business relationship with any company mentioned. The author has not received compensation for writing this article, other than from FXStreet.
FXStreet and the author do not provide personalized recommendations. The author makes no representations as to the accuracy, completeness, or suitability of this information. FXStreet and the author will not be liable for any errors, omissions or any losses, injuries or damages arising from this information and its display or use. Errors and omissions excepted.
The author and FXStreet are not registered investment advisors and nothing in this article is intended to be investment advice.