
- GBP/USD stabilizes near 1.3500 following Tuesday’s sharp decline.
- The US Dollar could benefit from a hot inflation reading and weigh on the pair.
- The technical outlook points to a bearish tilt in the near term.
After falling to a fresh weekly low near 1.3450 on Tuesday, GBP/USD corrects higher and holds steady at around 1.3500 in the European morning on Wednesday. The technical outlook points to a bearish tilt in the near term as markets await May inflation data from the US.
British Pound PRICE This week
The table below shows the percentage change of British Pound (GBP) against listed major currencies this week. British Pound was the weakest against the Euro.
| USD | EUR | GBP | JPY | CAD | AUD | NZD | CHF | |
|---|---|---|---|---|---|---|---|---|
| USD | -0.37% | 0.25% | 0.10% | -0.09% | -0.22% | -0.28% | -0.02% | |
| EUR | 0.37% | 0.60% | 0.45% | 0.26% | 0.17% | 0.07% | 0.34% | |
| GBP | -0.25% | -0.60% | -0.06% | -0.33% | -0.42% | -0.53% | -0.26% | |
| JPY | -0.10% | -0.45% | 0.06% | -0.18% | -0.38% | -0.44% | -0.23% | |
| CAD | 0.09% | -0.26% | 0.33% | 0.18% | -0.15% | -0.20% | 0.07% | |
| AUD | 0.22% | -0.17% | 0.42% | 0.38% | 0.15% | -0.10% | 0.18% | |
| NZD | 0.28% | -0.07% | 0.53% | 0.44% | 0.20% | 0.10% | 0.27% | |
| CHF | 0.02% | -0.34% | 0.26% | 0.23% | -0.07% | -0.18% | -0.27% |
The heat map shows percentage changes of major currencies against each other. The base currency is picked from the left column, while the quote currency is picked from the top row. For example, if you pick the British Pound from the left column and move along the horizontal line to the US Dollar, the percentage change displayed in the box will represent GBP (base)/USD (quote).
The disappointing labor market data from the UK, which highlighted an uptick in the Unemployment Rate alongside softer-than-expected wage inflation figures, revived expectations for the Bank of England (BoE) to cut rates multiple times this year and weighed on Pound Sterling. Reaffirming this view, a large majority of 59 economists that took part in a recently conducted Reuters poll noted that they see the BoE cutting the policy by 25 basis points (bps) in the third quarter and the fourth quarter, bringing down the bank rate to 3.75% from 4.25%, where it currently stands.
In the second half of the day, the US Bureau of Labor Statistics will release the Consumer Price Index (CPI) data for May. Investors forecast the core CPI, which excludes volatile food and energy prices, to rise 0.3% on a monthly basis.
A stronger-than-projected increase in this data could feed into expectations for a single rate Federal Reserve (Fed) rate cut in 2025. In this scenario, market participants could position themselves for a diverging BoE-Fed policy, causing GBP/USD to extend its slide. Conversely, a soft monthly core CPI print could hurt the USD with the immediate reaction and allow GBP/USD to erase a portion of Tuesday’s losses.
The CME FedWatch Tool currently shows that markets are pricing in about a 40% probability that the Fed will cut the policy rate once or none at all.
GBP/USD Technical Analysis
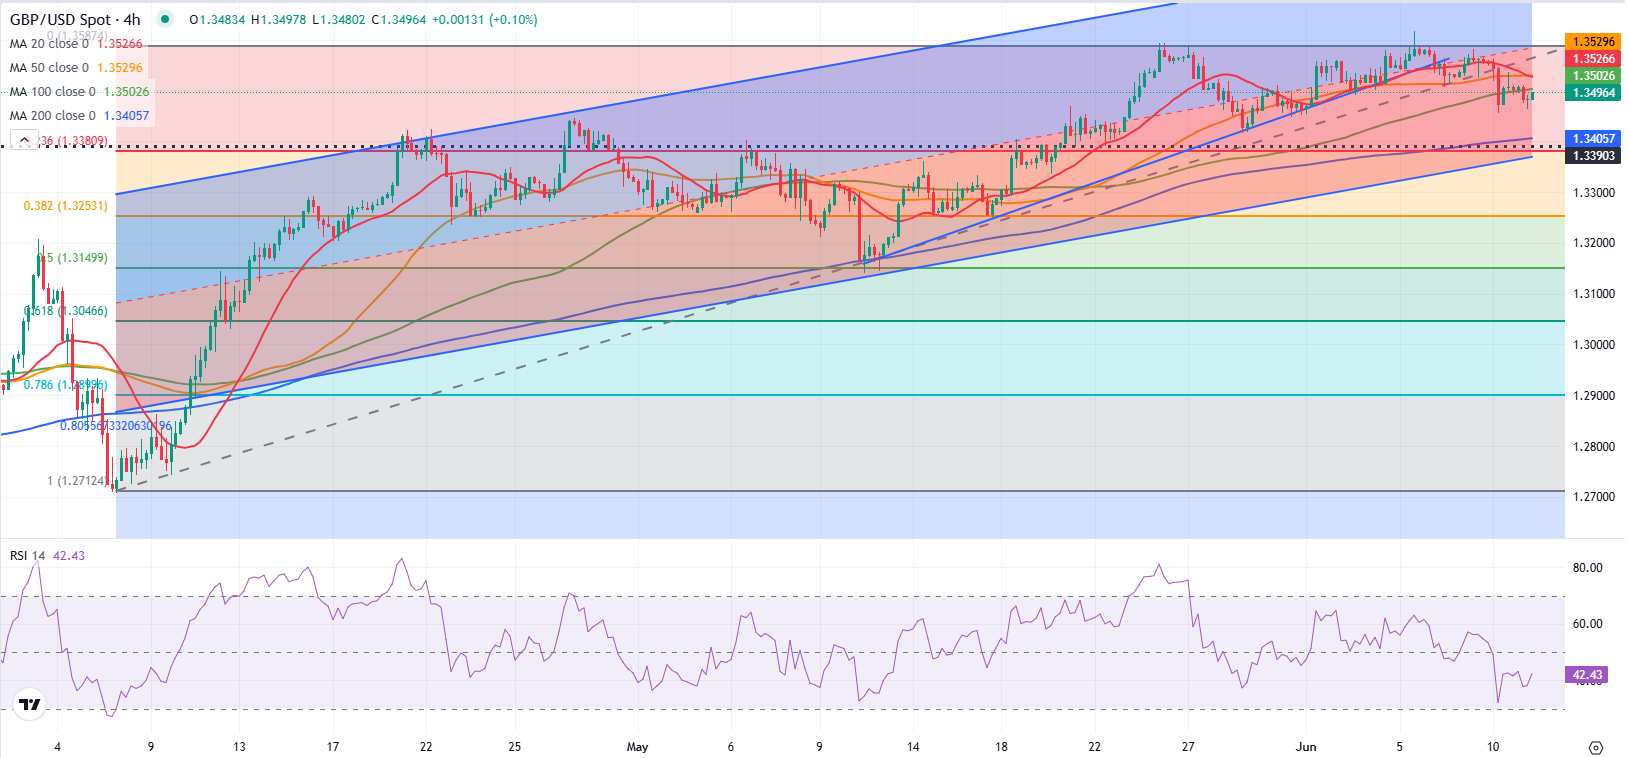
The Relative Strength Index (RSI) indicator stays near 40 on the 4-hour chart and GBP/USD continues to trade below the 100-period Simple Moving Average (SMA), suggesting that buyers remain hesitant to bet on additional recovery gains.
GBP/USD faces a pivot level at 1.3500 (100-period SMA, static level). In case the pair reclaims this level and starts using it as support, 1.3530 (20-period SMA; 50-period SMA) could be seen as the next interim resistance level before 1.3580 (mid-point of the ascending channel).
On the downside, supports are located at 1.3450 (static level), 1.3400 (200-period SMA) and 1.3370 (200-period SMA).
Inflation FAQs
Inflation measures the rise in the price of a representative basket of goods and services. Headline inflation is usually expressed as a percentage change on a month-on-month (MoM) and year-on-year (YoY) basis. Core inflation excludes more volatile elements such as food and fuel which can fluctuate because of geopolitical and seasonal factors. Core inflation is the figure economists focus on and is the level targeted by central banks, which are mandated to keep inflation at a manageable level, usually around 2%.
The Consumer Price Index (CPI) measures the change in prices of a basket of goods and services over a period of time. It is usually expressed as a percentage change on a month-on-month (MoM) and year-on-year (YoY) basis. Core CPI is the figure targeted by central banks as it excludes volatile food and fuel inputs. When Core CPI rises above 2% it usually results in higher interest rates and vice versa when it falls below 2%. Since higher interest rates are positive for a currency, higher inflation usually results in a stronger currency. The opposite is true when inflation falls.
Although it may seem counter-intuitive, high inflation in a country pushes up the value of its currency and vice versa for lower inflation. This is because the central bank will normally raise interest rates to combat the higher inflation, which attract more global capital inflows from investors looking for a lucrative place to park their money.
Formerly, Gold was the asset investors turned to in times of high inflation because it preserved its value, and whilst investors will often still buy Gold for its safe-haven properties in times of extreme market turmoil, this is not the case most of the time. This is because when inflation is high, central banks will put up interest rates to combat it. Higher interest rates are negative for Gold because they increase the opportunity-cost of holding Gold vis-a-vis an interest-bearing asset or placing the money in a cash deposit account. On the flipside, lower inflation tends to be positive for Gold as it brings interest rates down, making the bright metal a more viable investment alternative.
Information on these pages contains forward-looking statements that involve risks and uncertainties. Markets and instruments profiled on this page are for informational purposes only and should not in any way come across as a recommendation to buy or sell in these assets. You should do your own thorough research before making any investment decisions. FXStreet does not in any way guarantee that this information is free from mistakes, errors, or material misstatements. It also does not guarantee that this information is of a timely nature. Investing in Open Markets involves a great deal of risk, including the loss of all or a portion of your investment, as well as emotional distress. All risks, losses and costs associated with investing, including total loss of principal, are your responsibility. The views and opinions expressed in this article are those of the authors and do not necessarily reflect the official policy or position of FXStreet nor its advertisers. The author will not be held responsible for information that is found at the end of links posted on this page.
If not otherwise explicitly mentioned in the body of the article, at the time of writing, the author has no position in any stock mentioned in this article and no business relationship with any company mentioned. The author has not received compensation for writing this article, other than from FXStreet.
FXStreet and the author do not provide personalized recommendations. The author makes no representations as to the accuracy, completeness, or suitability of this information. FXStreet and the author will not be liable for any errors, omissions or any losses, injuries or damages arising from this information and its display or use. Errors and omissions excepted.
The author and FXStreet are not registered investment advisors and nothing in this article is intended to be investment advice.